> ## Documentation Index
> Fetch the complete documentation index at: https://docs.tryprofound.com/llms.txt
> Use this file to discover all available pages before exploring further.
# Fastly HTTPS Endpoint
> This documentation explains how to set up Fastly real-time logs delivery to Profound Agent Analytics platform using Fastly custom HTTPS Endpoint
## Overview
The integration uses Fastly's custom HTTPS endpoint to forward Fastly real-time logs to our Agent Analytics API. Fastly's real-time log streaming offers instant visibility into traffic, performance, threats, and troubleshooting, and streams logs to various destinations including HTTP endpoints. For more information about Fastly real-time logs, [visit the Fastly documentation](https://docs.fastly.com/en/guides/streaming-logs).
## Prerequisites
* A Fastly account
* Access/permission to edit Logging Endpoints
* A Profound Log Ingestion Token for Agent Analytics
## Configuration
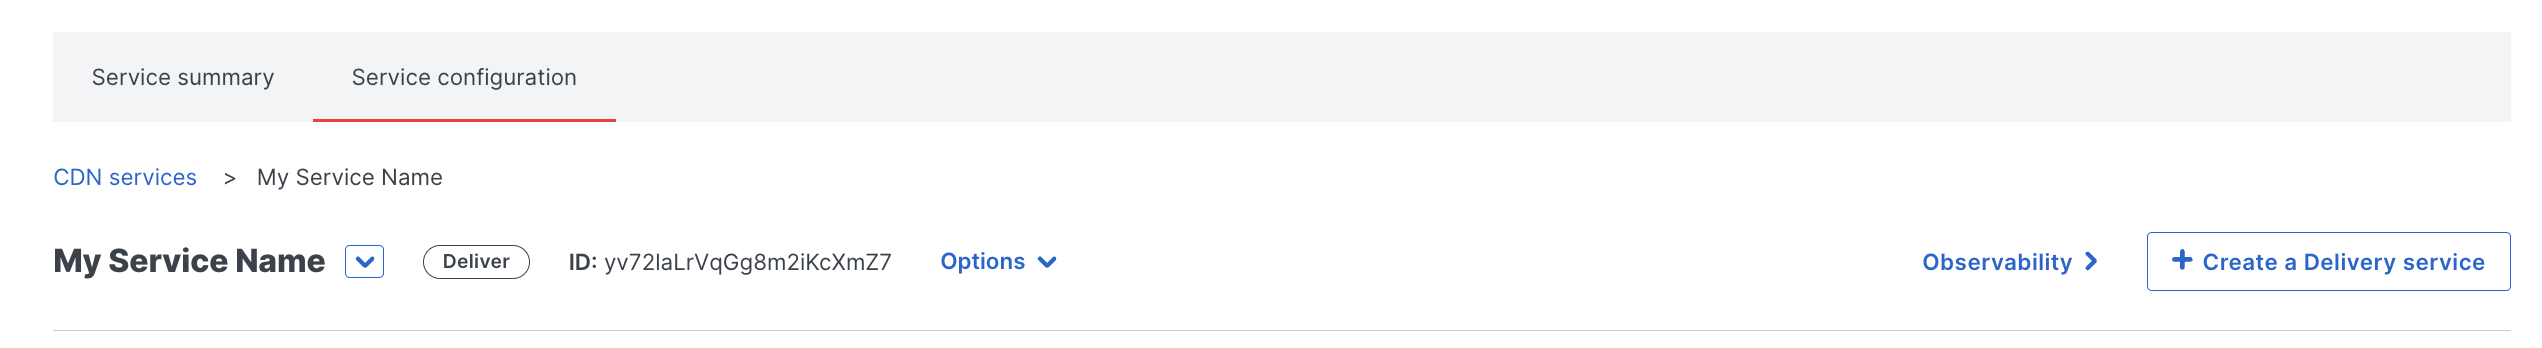
 Sign into the Fastly console, select your service, and navigate to the Service configuration tab.
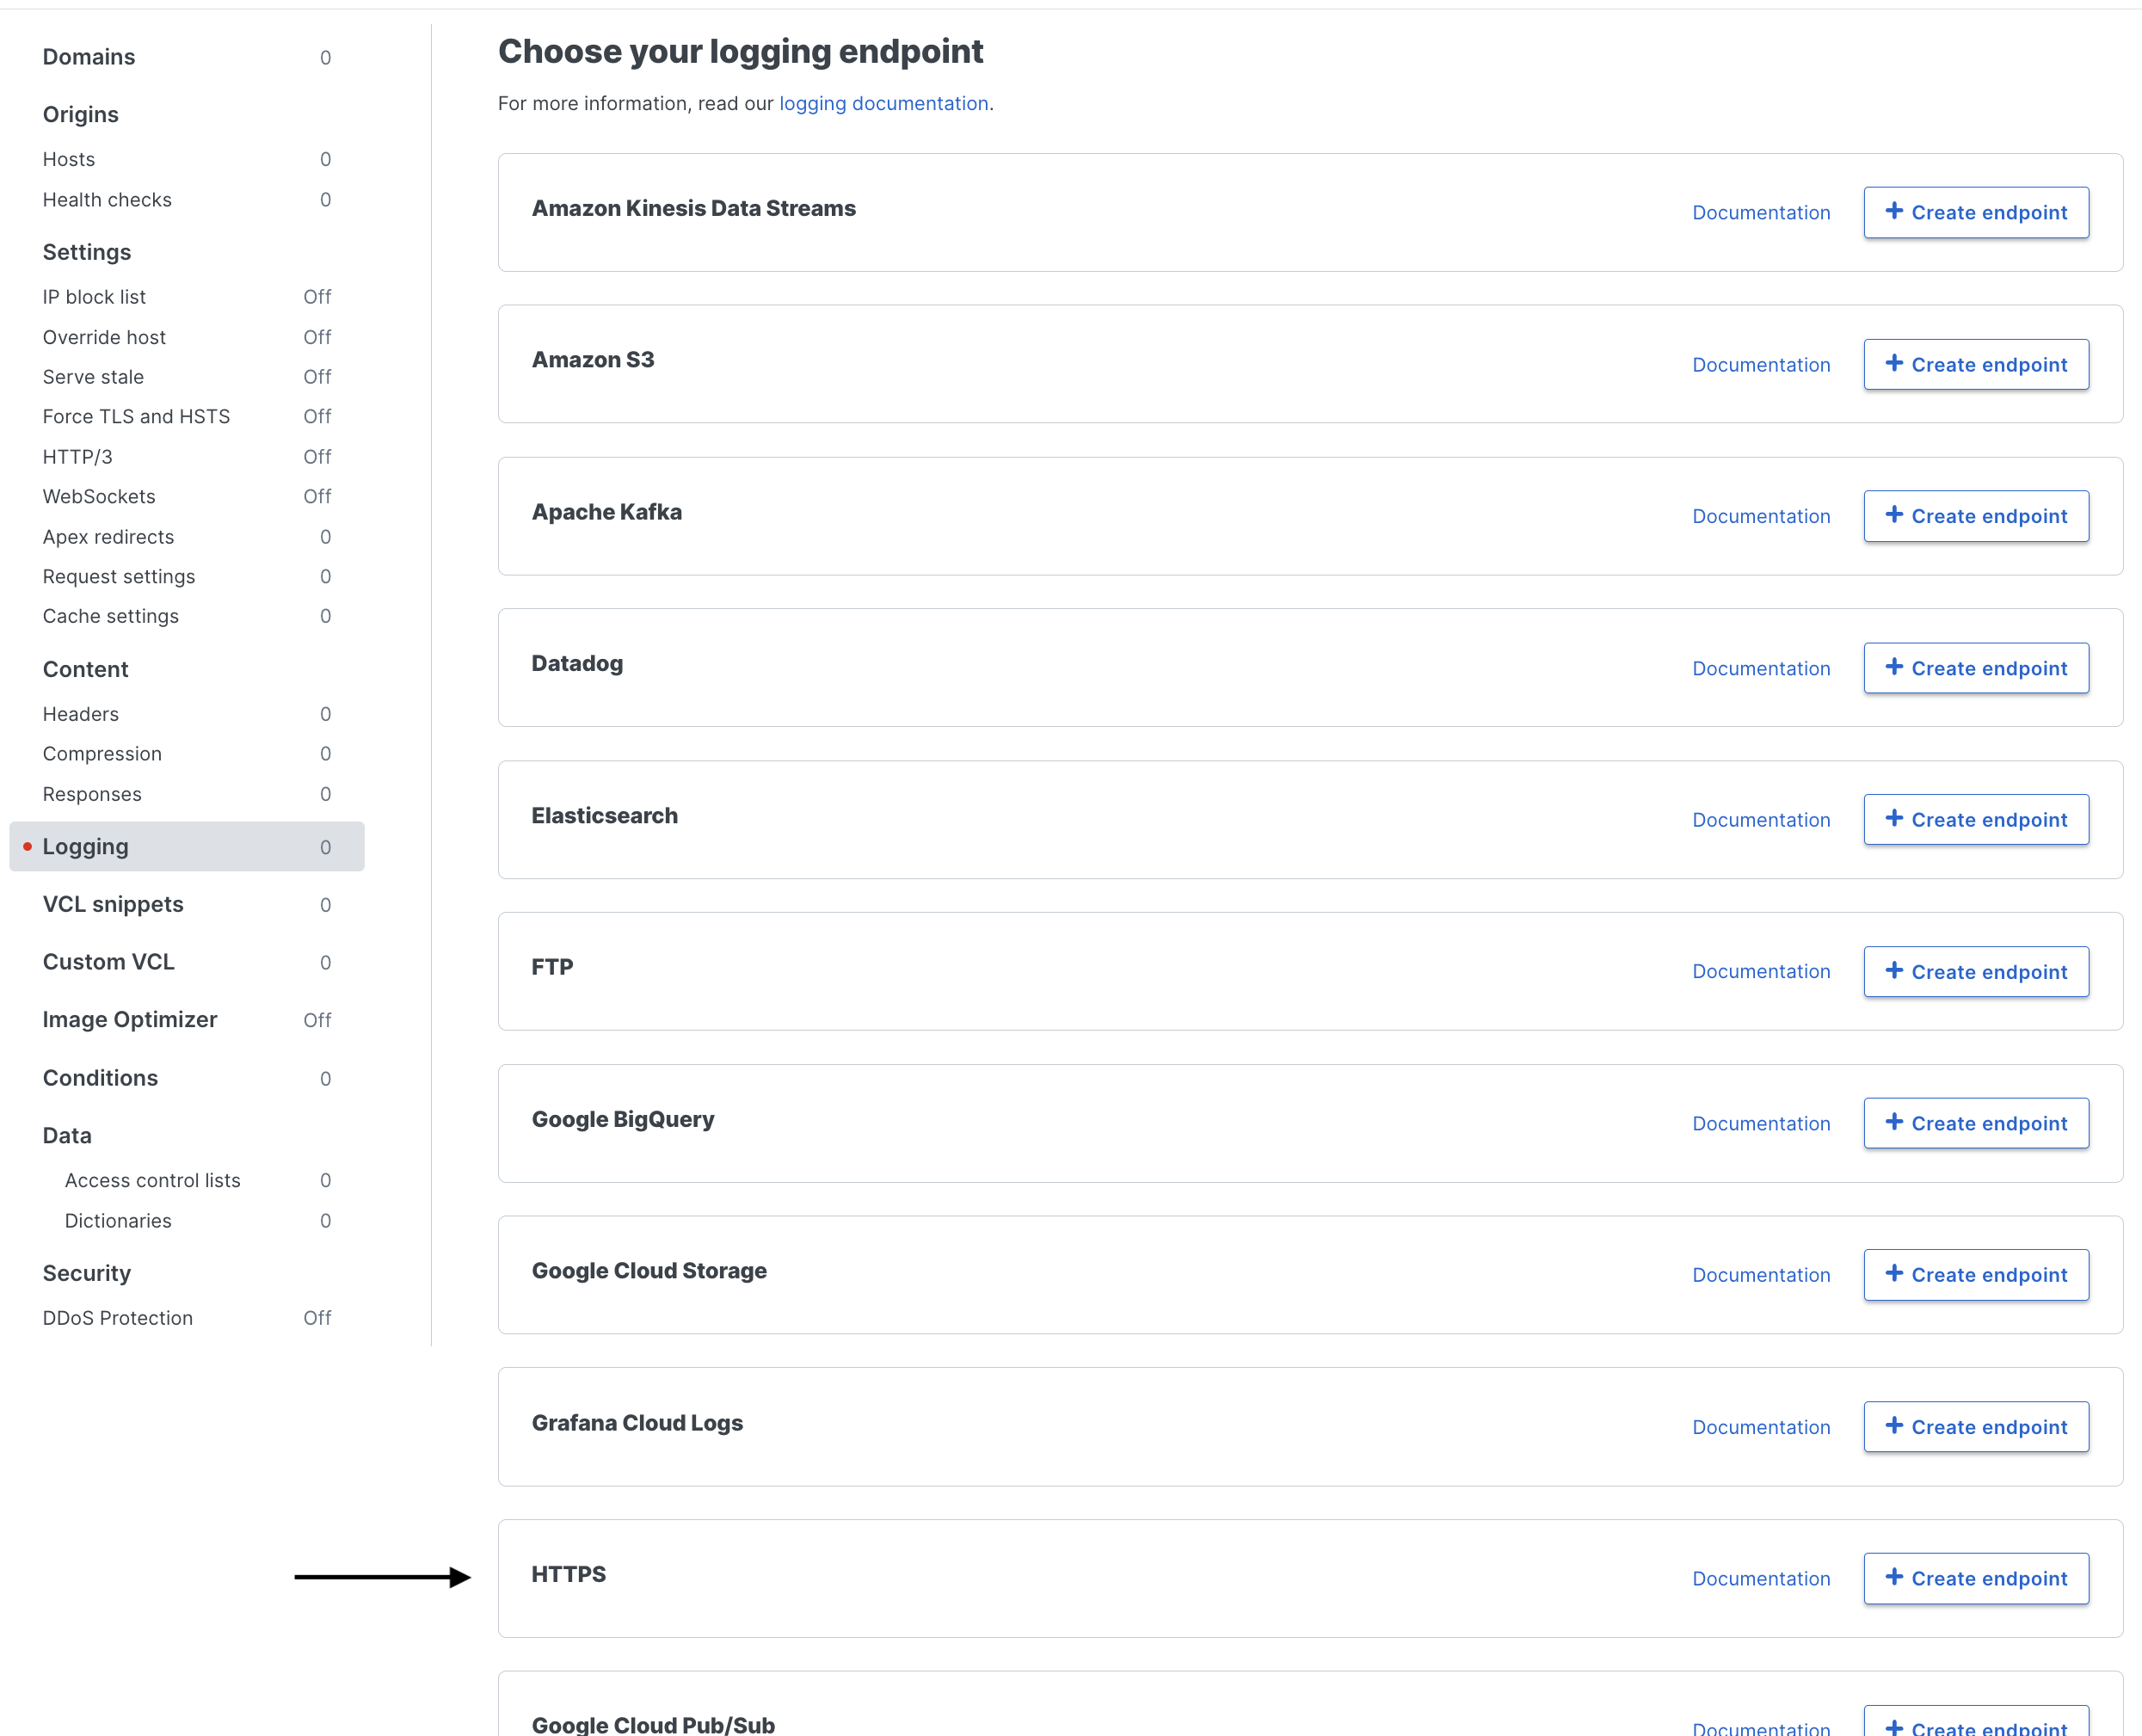
 Select "Edit configuration" and navigate to the Logging section.
Find "HTTPS" and click `+ Create endpoint`
Select "Edit configuration" and navigate to the Logging section.
Find "HTTPS" and click `+ Create endpoint`
 Configure your HTTPS endpoint with the following settings:
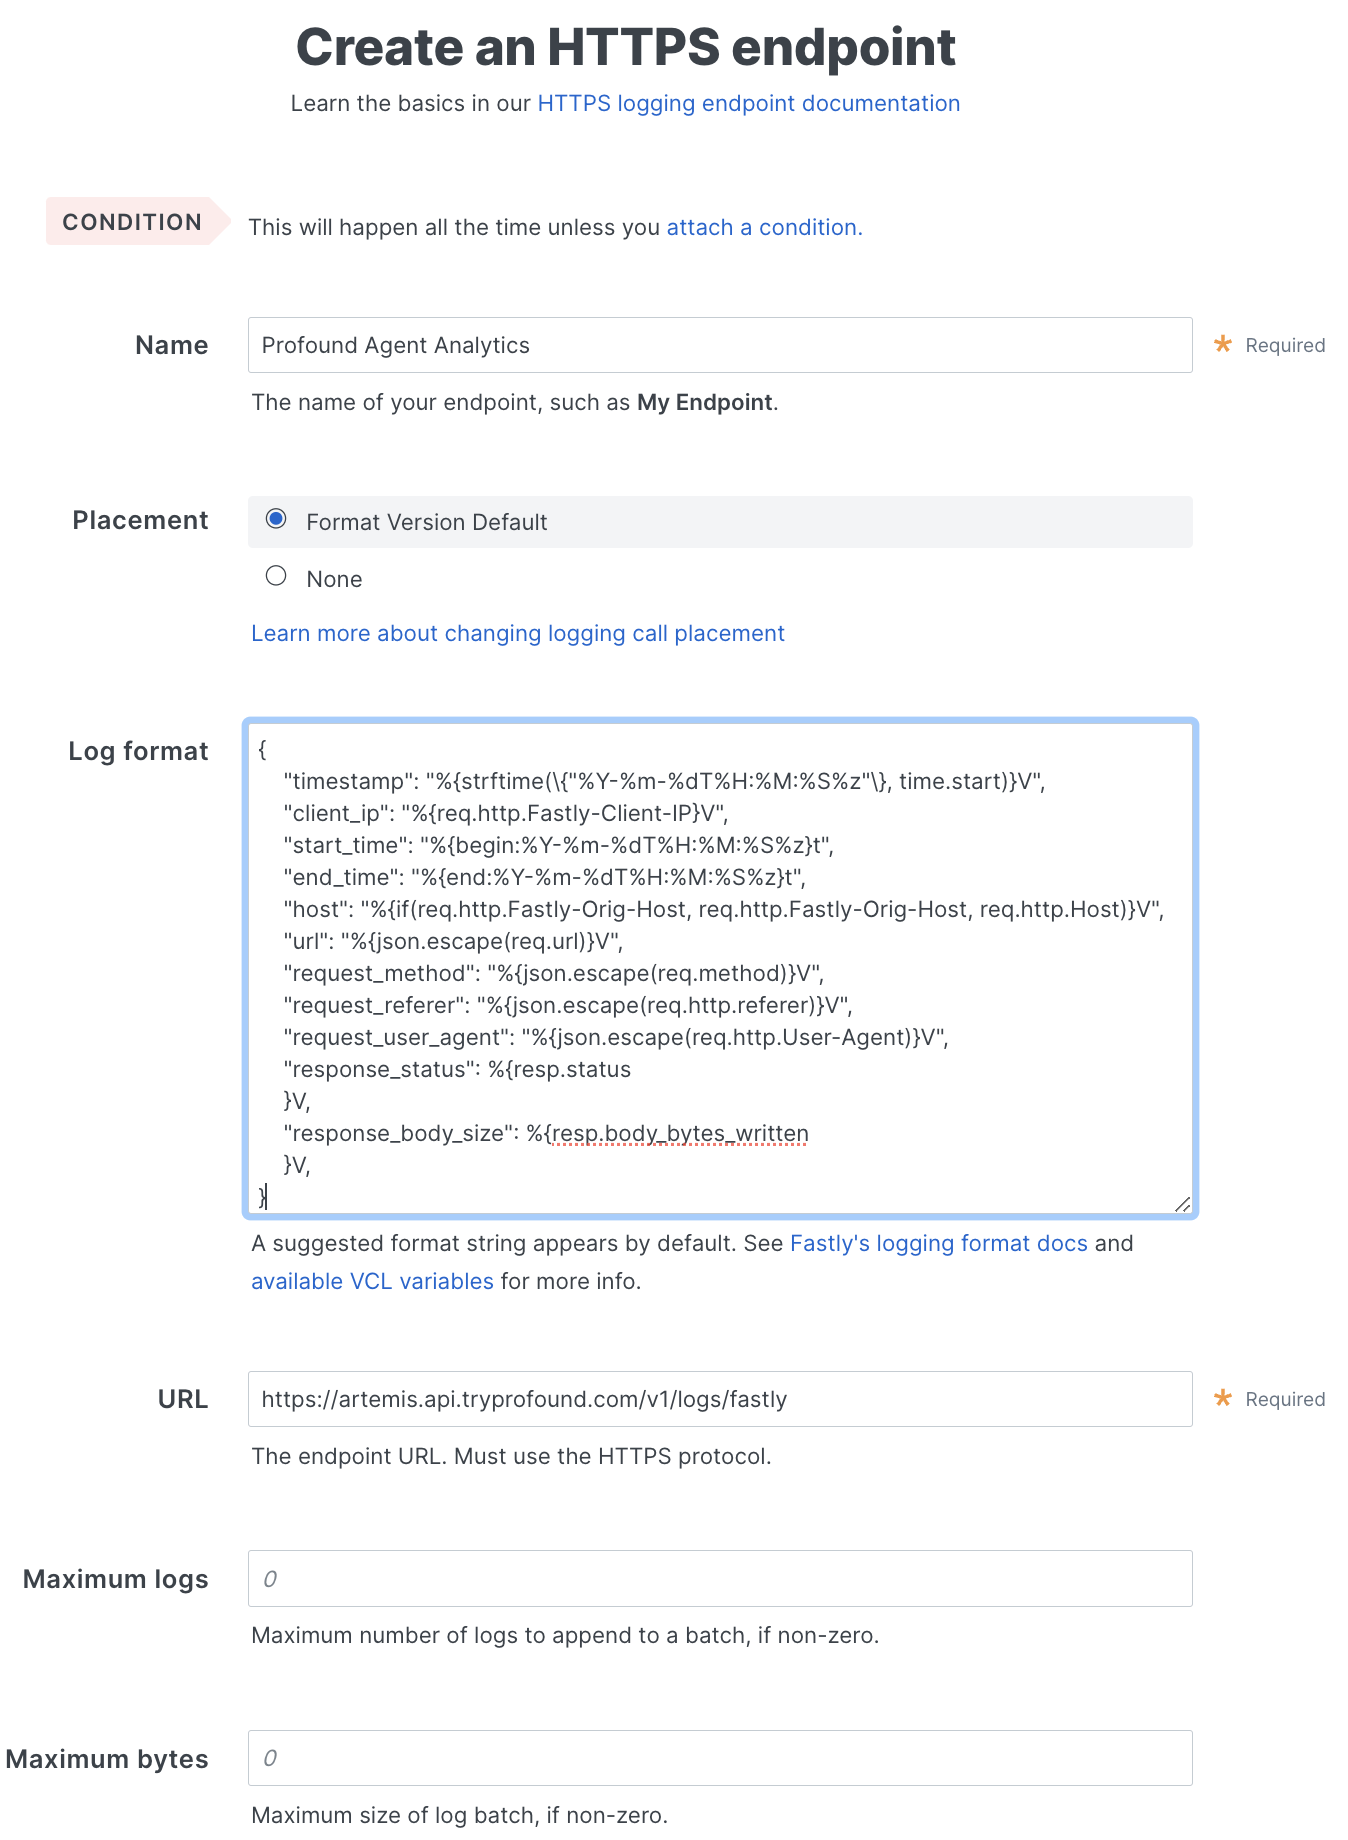 * **Name:** Add an informative name
* **Placement:** Use the default
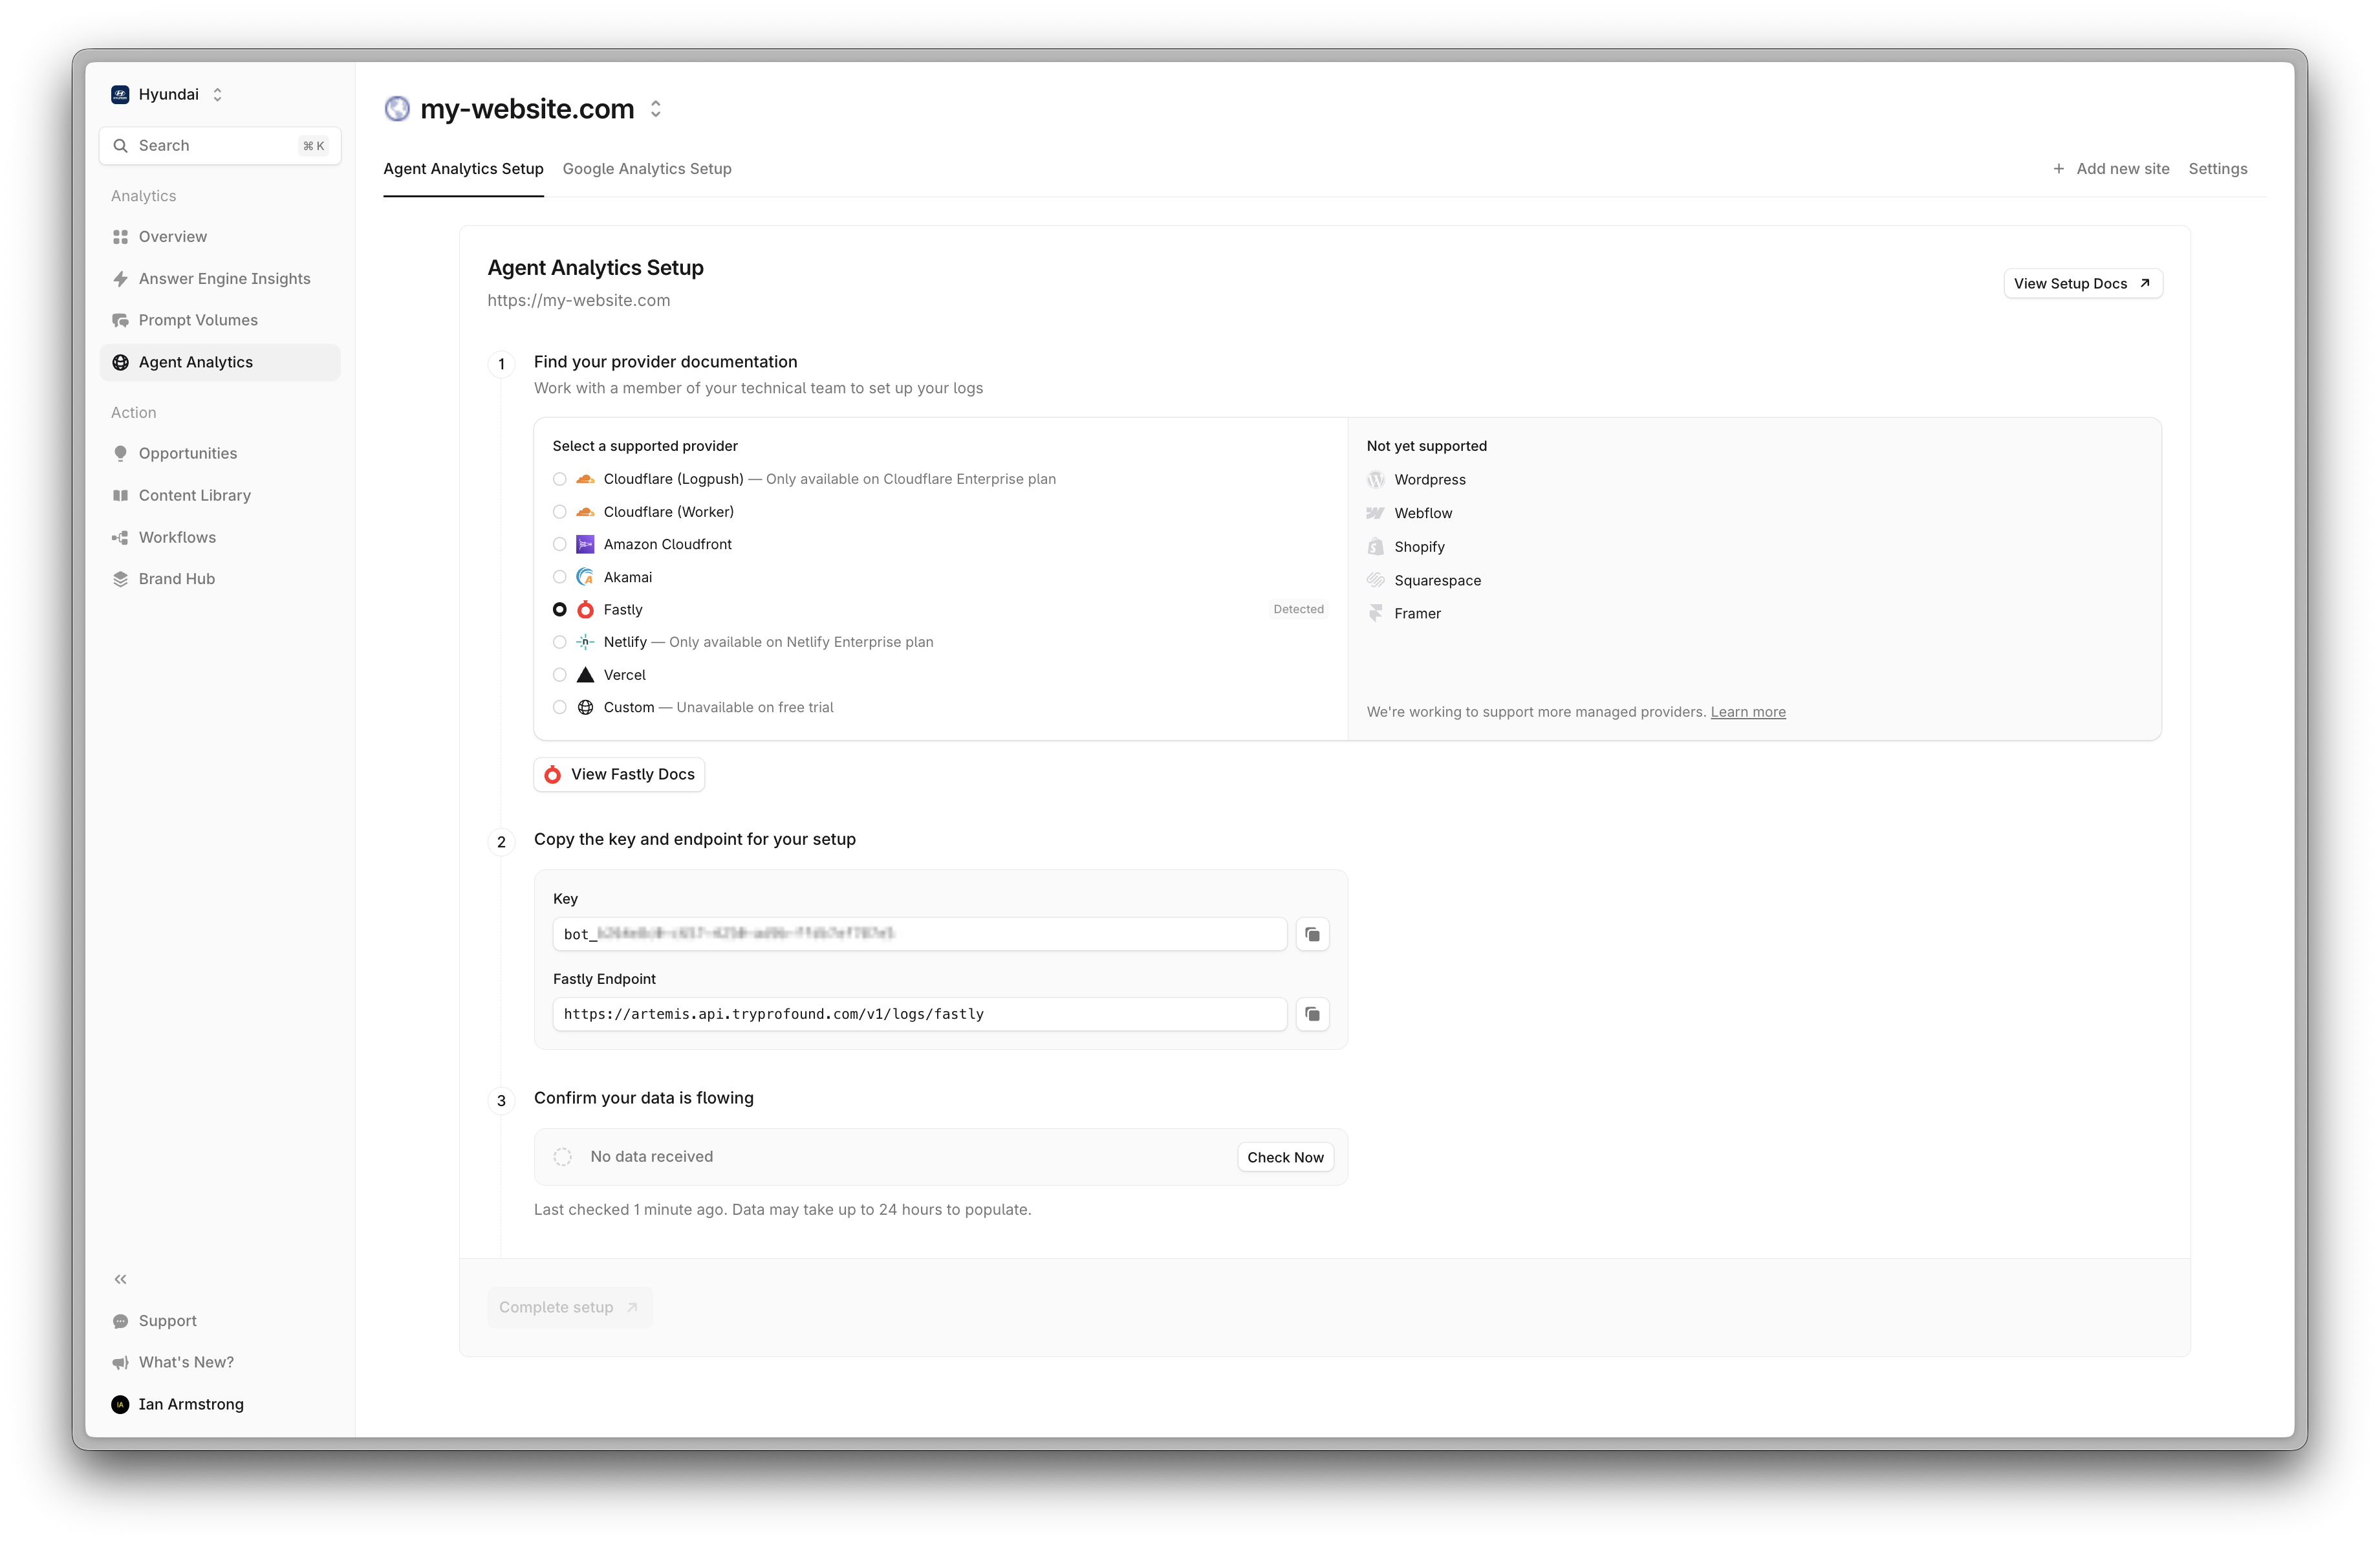
* **URL:** Enter `https://artemis.api.tryprofound.com/v1/logs/fastly`
* **Maximum logs & Maximum bytes:** Optional, configure as needed.
* **Log format**: Paste the following log format. This governs what information will be sent to the Agent Analytics API. If you use a different format, your logs may be rejected by the API.
```
{
"timestamp": "%{strftime(\{"%Y-%m-%dT%H:%M:%S%z"\}, time.start)}V",
"client_ip": "%{req.http.Fastly-Client-IP}V",
"start_time": "%{begin:%Y-%m-%dT%H:%M:%S%z}t",
"end_time": "%{end:%Y-%m-%dT%H:%M:%S%z}t",
"host": "%{req.http.Host}V",
"url": "%{json.escape(req.url)}V",
"request_method": "%{json.escape(req.method)}V",
"request_referer": "%{json.escape(req.http.referer)}V",
"request_user_agent": "%{json.escape(req.http.User-Agent)}V",
"response_status": %{resp.status}V,
"response_body_size": %{resp.body_bytes_written}V
}
```
* Time and IP
* `timestamp` - Time when the request was completed
* `client_ip` - Client IP address
* Request Details
* `request_method` - HTTP request method
* `host` - Requested host header
* `url` - Request url path
* `request_referer` - Request referrer
* `request_user_agent` - Client user agent
* Response Details
* `start_time` - The time at which the request began
* `end_time` - The time at which the request finished
* `response_status` - HTTP response status
* `response_body_size` - Response size in bytes
*For more information see the [documentation](https://docs.fastly.com/en/guides/useful-variables-to-log)*
You may see a warning like:
* **Name:** Add an informative name
* **Placement:** Use the default
* **URL:** Enter `https://artemis.api.tryprofound.com/v1/logs/fastly`
* **Maximum logs & Maximum bytes:** Optional, configure as needed.
* **Log format**: Paste the following log format. This governs what information will be sent to the Agent Analytics API. If you use a different format, your logs may be rejected by the API.
```
{
"timestamp": "%{strftime(\{"%Y-%m-%dT%H:%M:%S%z"\}, time.start)}V",
"client_ip": "%{req.http.Fastly-Client-IP}V",
"start_time": "%{begin:%Y-%m-%dT%H:%M:%S%z}t",
"end_time": "%{end:%Y-%m-%dT%H:%M:%S%z}t",
"host": "%{req.http.Host}V",
"url": "%{json.escape(req.url)}V",
"request_method": "%{json.escape(req.method)}V",
"request_referer": "%{json.escape(req.http.referer)}V",
"request_user_agent": "%{json.escape(req.http.User-Agent)}V",
"response_status": %{resp.status}V,
"response_body_size": %{resp.body_bytes_written}V
}
```
* Time and IP
* `timestamp` - Time when the request was completed
* `client_ip` - Client IP address
* Request Details
* `request_method` - HTTP request method
* `host` - Requested host header
* `url` - Request url path
* `request_referer` - Request referrer
* `request_user_agent` - Client user agent
* Response Details
* `start_time` - The time at which the request began
* `end_time` - The time at which the request finished
* `response_status` - HTTP response status
* `response_body_size` - Response size in bytes
*For more information see the [documentation](https://docs.fastly.com/en/guides/useful-variables-to-log)*
You may see a warning like:
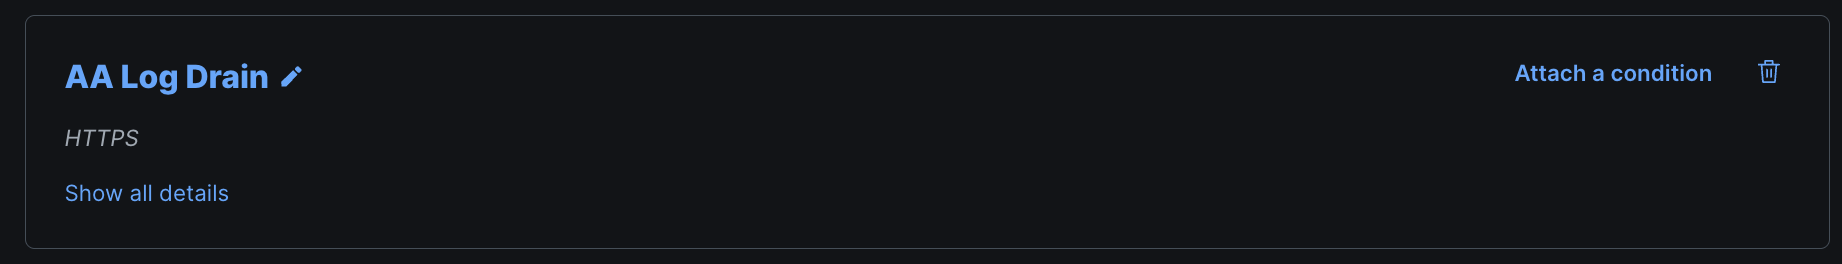
 You can safely ignore this message. The validation has been configured for you.
Next, click "Attach a condition"
You can safely ignore this message. The validation has been configured for you.
Next, click "Attach a condition"

 Enter the following using your domain name:
`req.http.host == "my-website.com"`
Enter the following using your domain name:
`req.http.host == "my-website.com"`
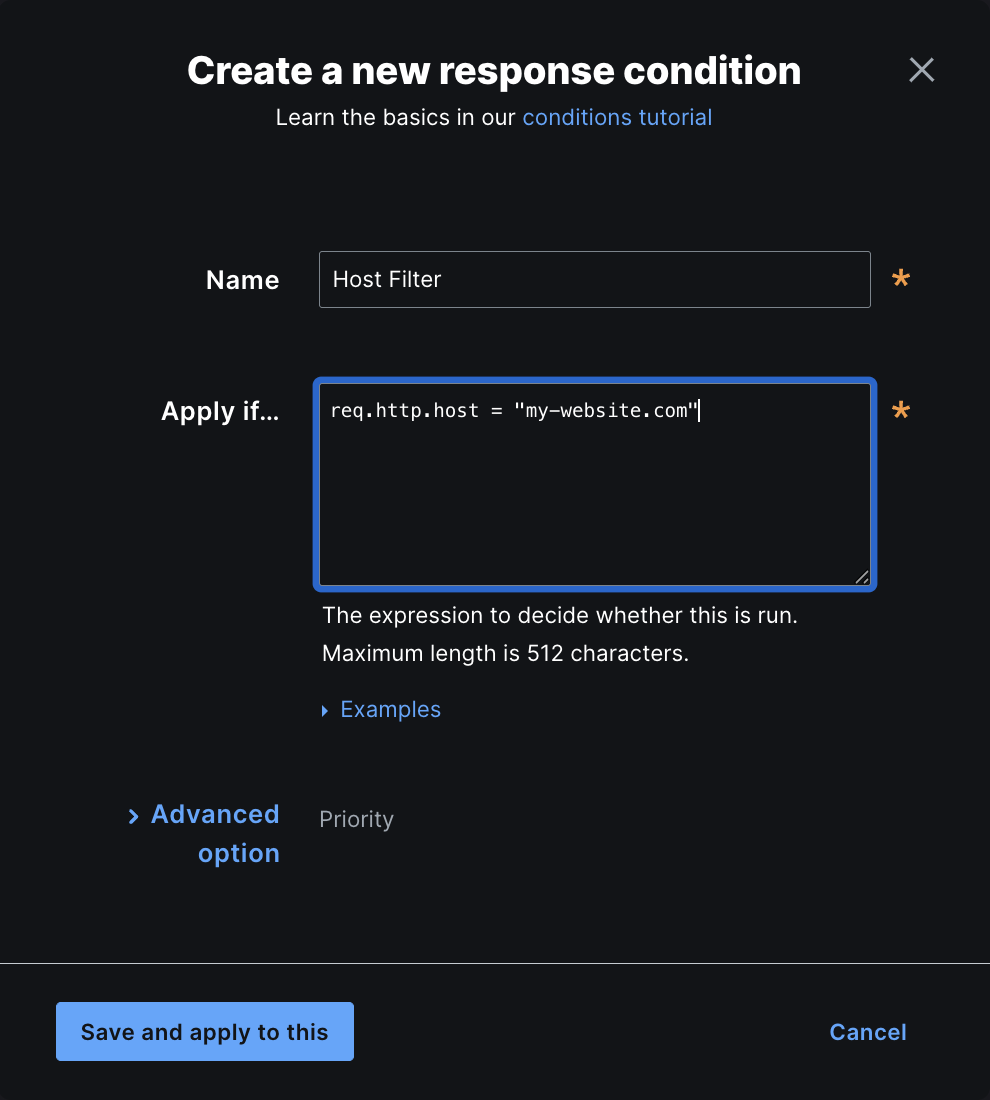 This filter will ensure that only logs for your selected domain are sent to Profound. Select `Save and apply`.
Scroll down to "Advanced options"
This filter will ensure that only logs for your selected domain are sent to Profound. Select `Save and apply`.
Scroll down to "Advanced options"
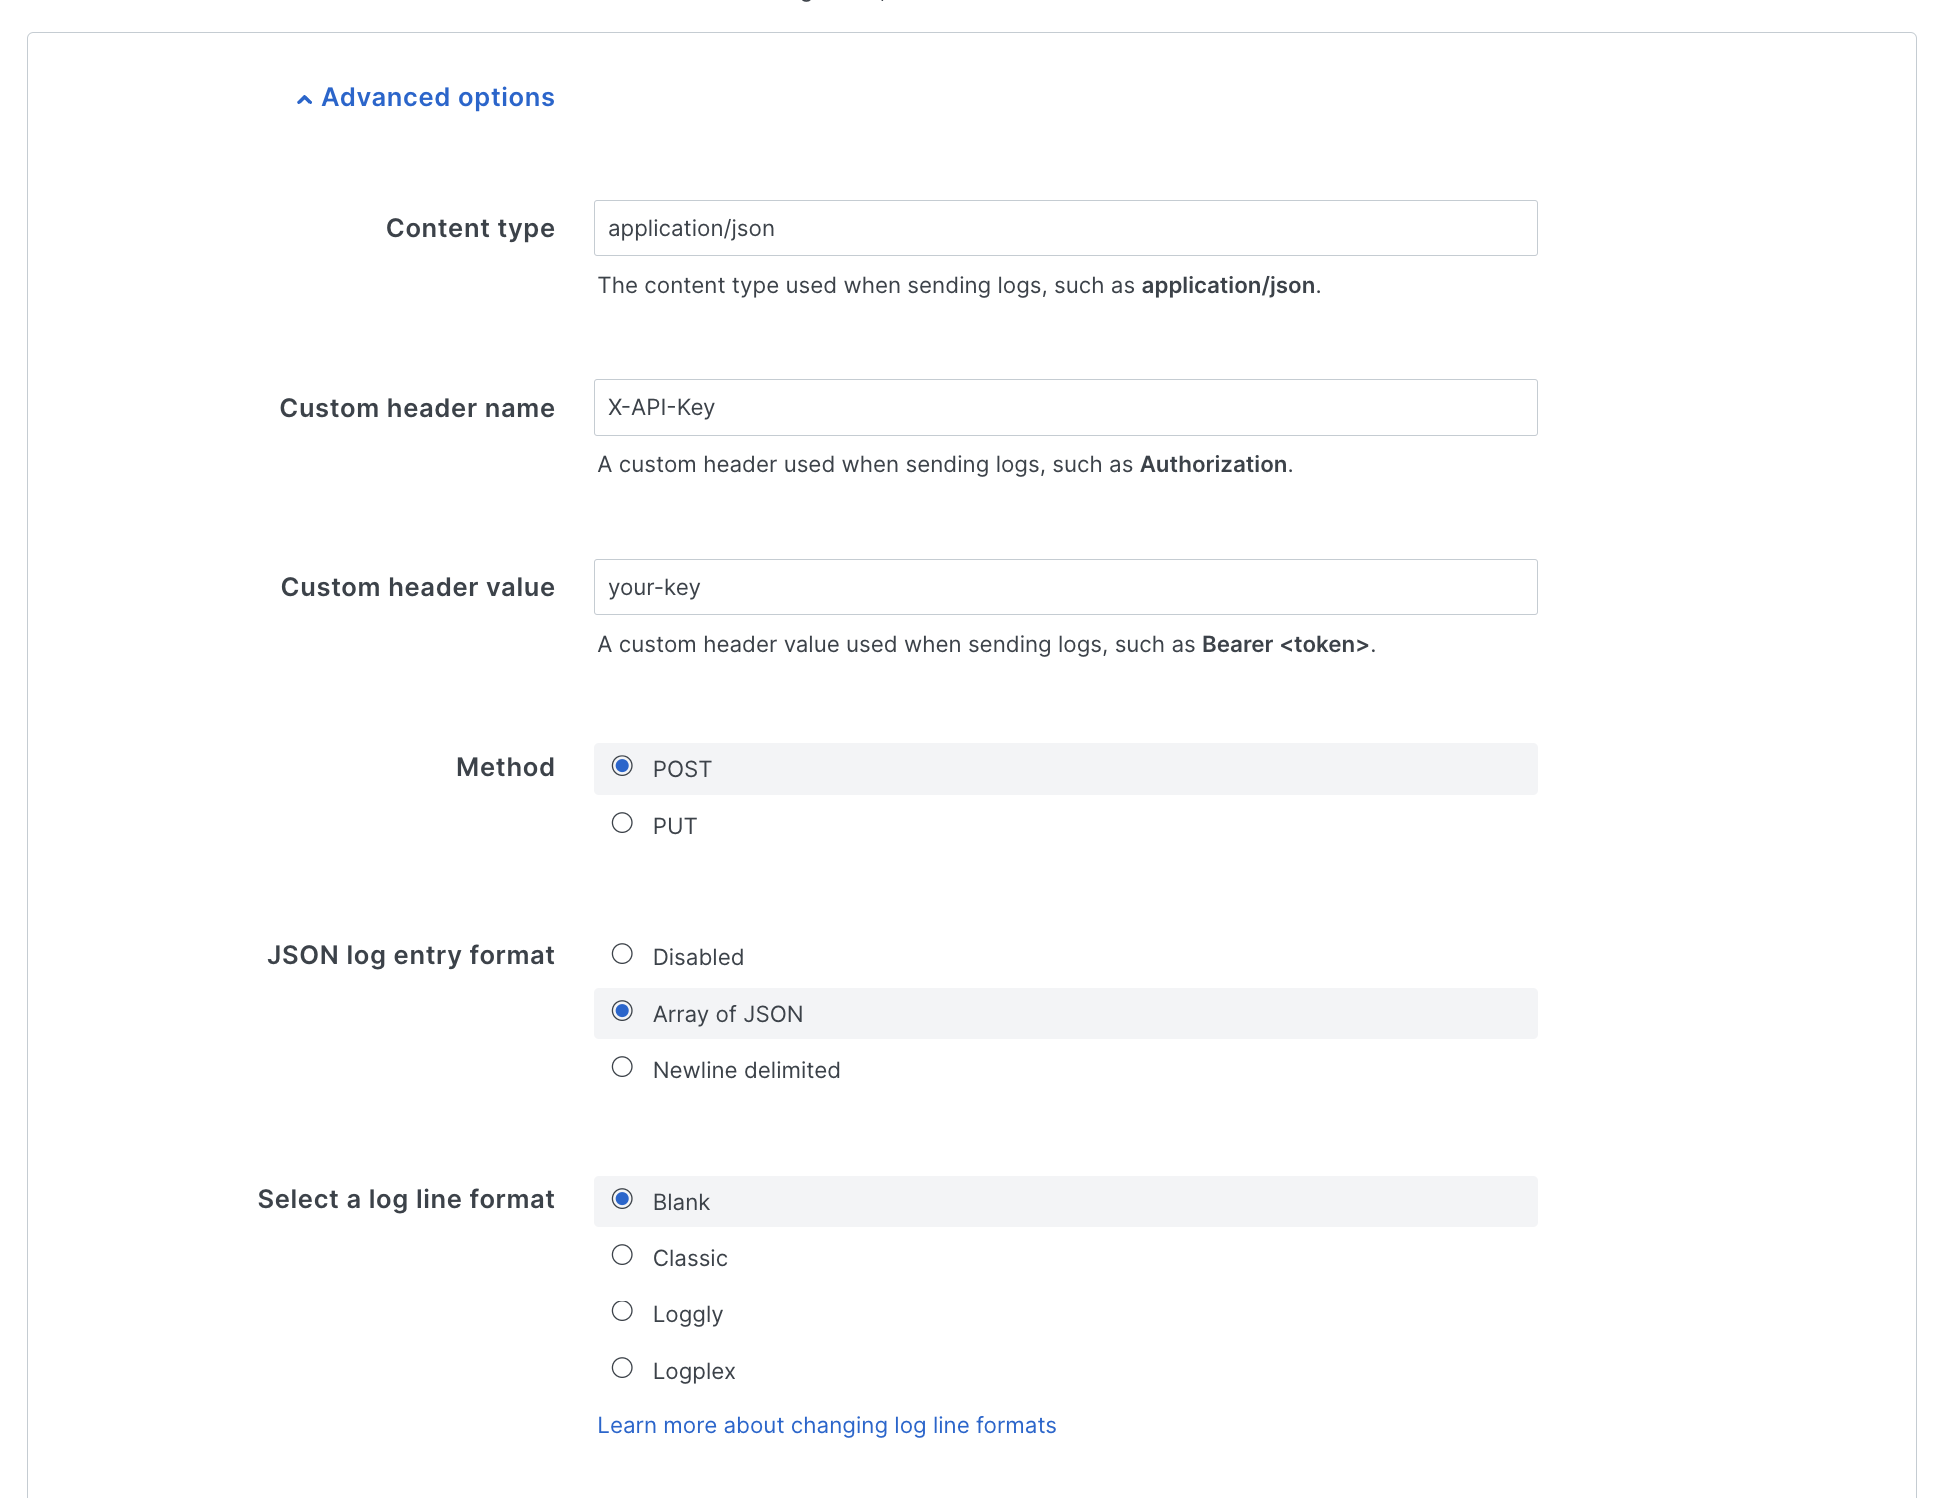 Configure:
* **Content type** - `application/json`
* **Custom header name** - `X-API-Key`
* **Custom header value** - Your provisioned Log Ingestion Token for Profound's Agent Analytics Platform (`bot_PROFOUND_LOG_INGESTION_TOKEN`)
* **Method** - `POST`
* **JSON log entry format** - `Array of JSON`
* **Select a log line format** - `Blank`
Save your configuration and activate the new service version.
That's it! Fastly will now send real-time logs to Profound. Data should begin appearing in your dashboard within a few minutes.
## Troubleshooting
* If logs aren't appearing, verify your HTTPS endpoint configuration
* Check fastly for delivery errors
* Verify your Log Ingestion Token is correct
* Verify your API endpoint is correct
## Additional Resources
* [Fastly's real-time log streaming](https://docs.fastly.com/en/guides/about-fastlys-realtime-log-streaming-features)
* [Log streaming: HTTPS](https://docs.fastly.com/en/guides/log-streaming-https)
* [Log Formats](https://docs.fastly.com/en/guides/useful-log-formats)
* Contact [support@tryprofound.com](mailto:support@tryprofound.com) for API-related questions
Configure:
* **Content type** - `application/json`
* **Custom header name** - `X-API-Key`
* **Custom header value** - Your provisioned Log Ingestion Token for Profound's Agent Analytics Platform (`bot_PROFOUND_LOG_INGESTION_TOKEN`)
* **Method** - `POST`
* **JSON log entry format** - `Array of JSON`
* **Select a log line format** - `Blank`
Save your configuration and activate the new service version.
That's it! Fastly will now send real-time logs to Profound. Data should begin appearing in your dashboard within a few minutes.
## Troubleshooting
* If logs aren't appearing, verify your HTTPS endpoint configuration
* Check fastly for delivery errors
* Verify your Log Ingestion Token is correct
* Verify your API endpoint is correct
## Additional Resources
* [Fastly's real-time log streaming](https://docs.fastly.com/en/guides/about-fastlys-realtime-log-streaming-features)
* [Log streaming: HTTPS](https://docs.fastly.com/en/guides/log-streaming-https)
* [Log Formats](https://docs.fastly.com/en/guides/useful-log-formats)
* Contact [support@tryprofound.com](mailto:support@tryprofound.com) for API-related questions