> ## Documentation Index
> Fetch the complete documentation index at: https://docs.tryprofound.com/llms.txt
> Use this file to discover all available pages before exploring further.
# Chart annotations in AEI
> Mark events on Answer Engine Insights charts to explain changes in your metrics over time
**Available on:** the Enterprise plan
**Find it in:** Analytics > Answer Engine Insights
**Required role:** all roles can view, Admin and Editor can create and manage. Prompt update annotations require the View Activity Logs permission.
Chart Annotations are notes pinned to a date on a chart. Use them to record events, such as a product launch, a content refresh, or a change to your prompts, so anyone looking at a trend can see the context behind it.
## View annotations
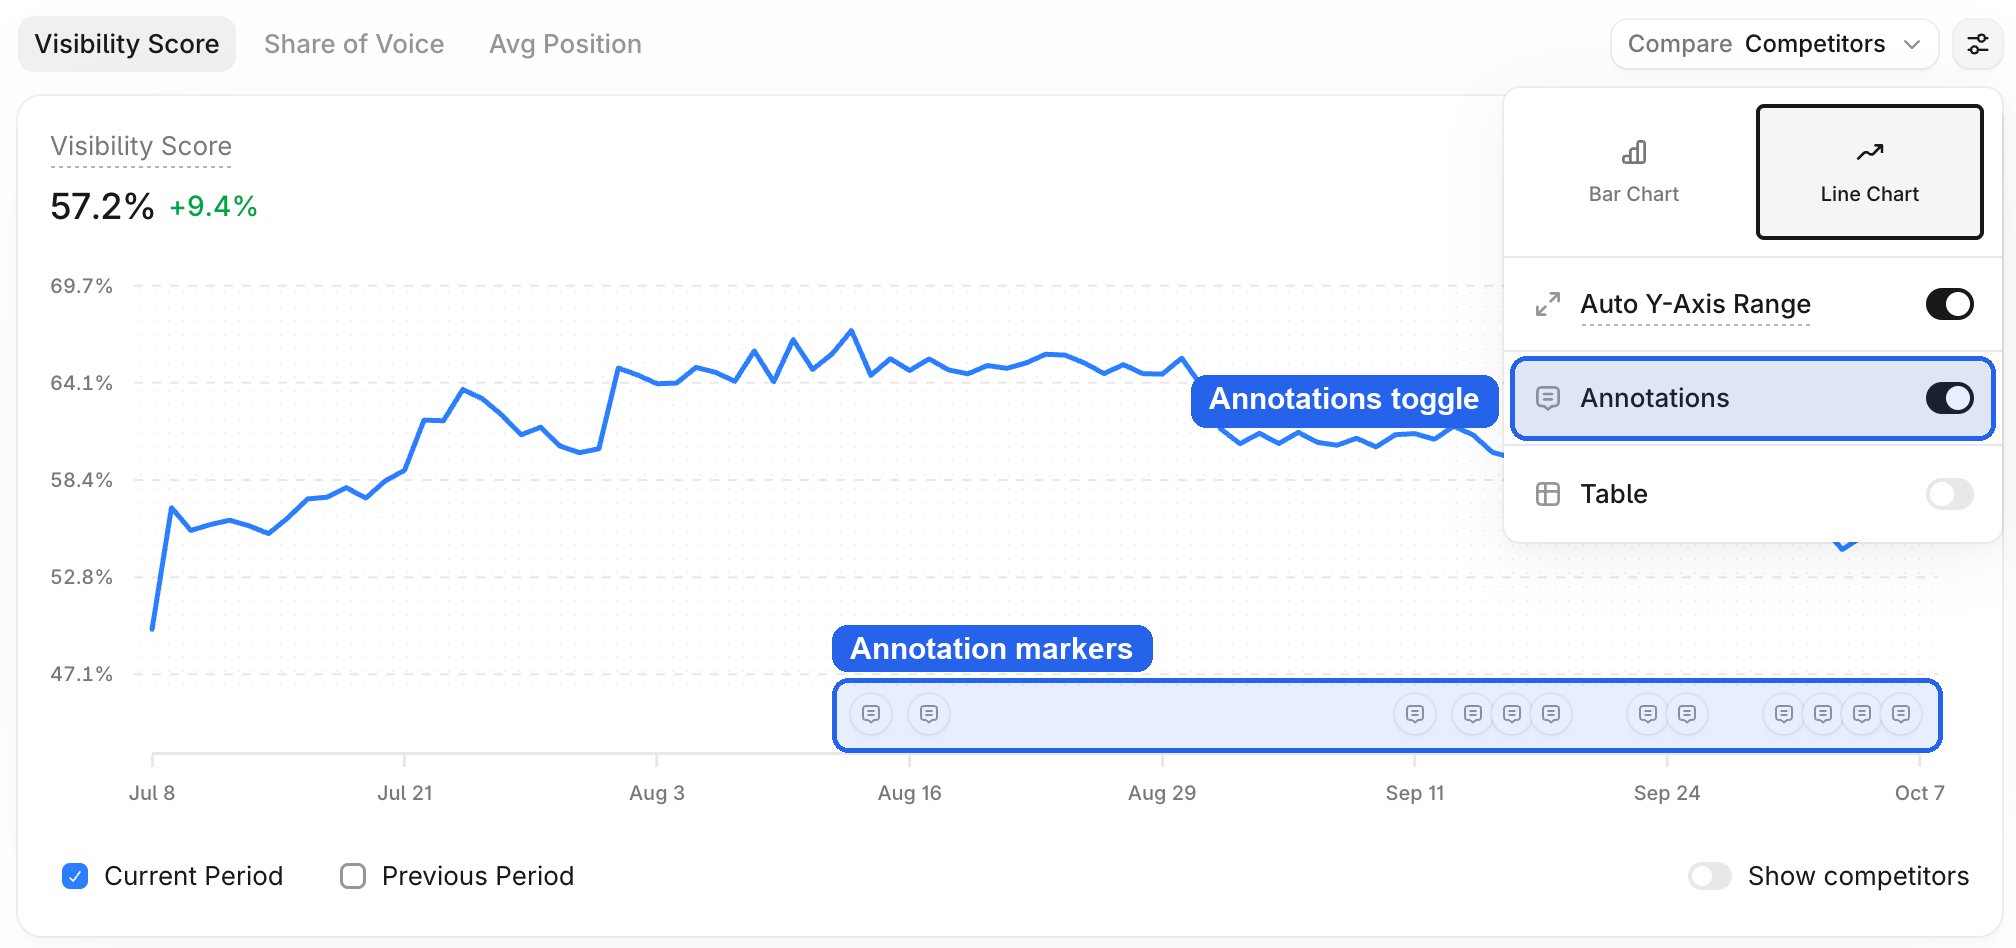
Annotations appear on all time-series line charts in [Answer Engine Insights](/answer-engine-insights/about). AI Marketer (Aim) can also show annotations on the line charts it generates.
1. Find the annotation markers along the bottom of a line chart.
2. Select a marker to see every annotation for that date, newest first. When dates are close together, their markers merge into one.
To hide annotations, open the chart’s settings (the sliders icon) and turn off **Annotations**.
 ## Types of annotations
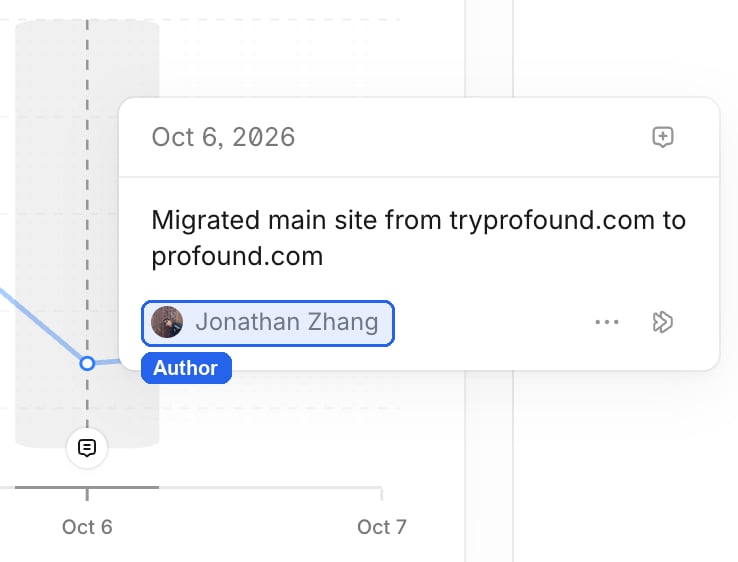
### User annotations
Created by people in your organization. Shows anything your team wants to record.
## Types of annotations
### User annotations
Created by people in your organization. Shows anything your team wants to record.
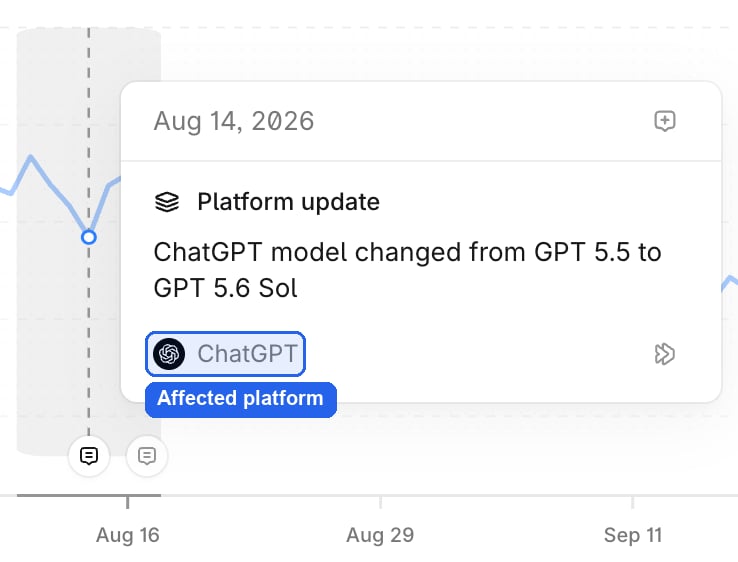
 ### Platform updates
Created automatically by Profound for a model change on an AI platform that it tracks, such as a new ChatGPT model. Platform updates are hidden when that platform isn’t selected in your model filter.
### Platform updates
Created automatically by Profound for a model change on an AI platform that it tracks, such as a new ChatGPT model. Platform updates are hidden when that platform isn’t selected in your model filter.
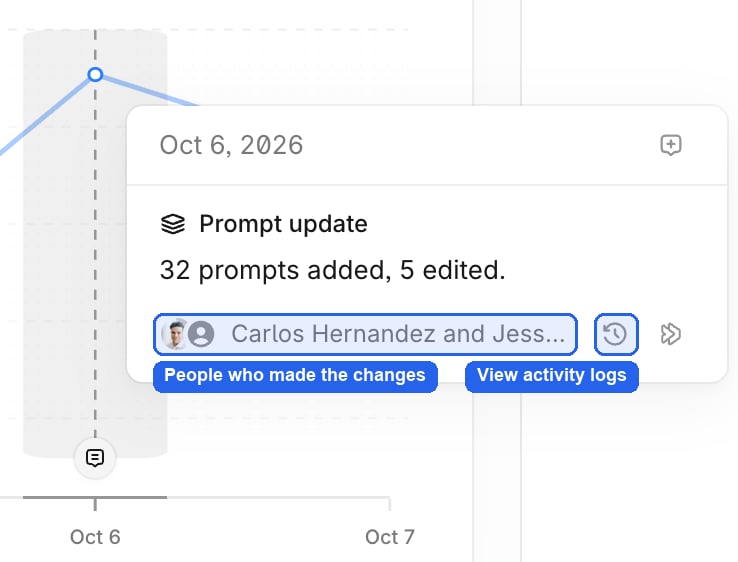
 ### Prompt updates
Created automatically by Profound for a daily summary of prompt changes in a category, for example “12 prompts added, 3 disabled.” Prompt updates list the people who made the changes. Select **View activity logs** to see each change in Activity Logs.
### Prompt updates
Created automatically by Profound for a daily summary of prompt changes in a category, for example “12 prompts added, 3 disabled.” Prompt updates list the people who made the changes. Select **View activity logs** to see each change in Activity Logs.
 ## Add an annotation
Add an annotation in any of the following ways:
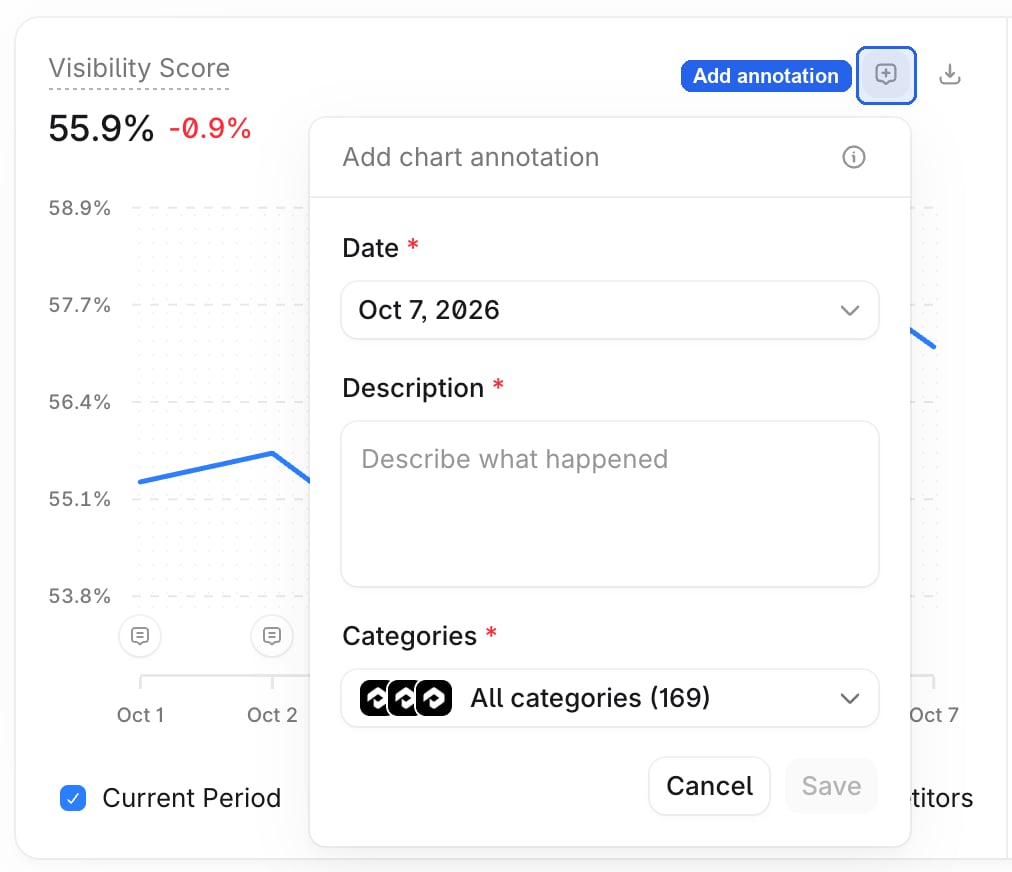
* Select **Add annotation** at the top right of a chart. The date defaults to the end of your selected date range.
## Add an annotation
Add an annotation in any of the following ways:
* Select **Add annotation** at the top right of a chart. The date defaults to the end of your selected date range.
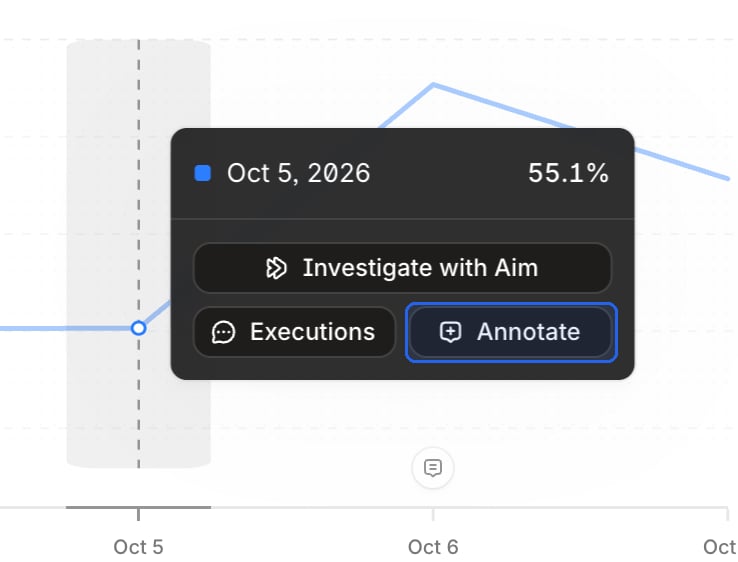
 * Select a single date on a chart to pin it, then select **Annotate** in the tooltip.
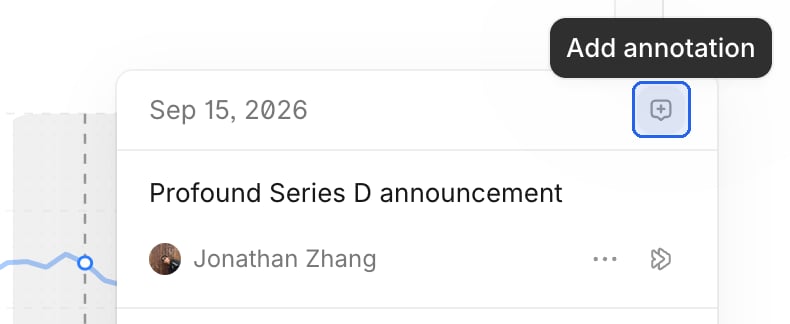
 * In an open annotation list, select **Add annotation** next to a date.
 Fill in the **Add chart annotation** form:
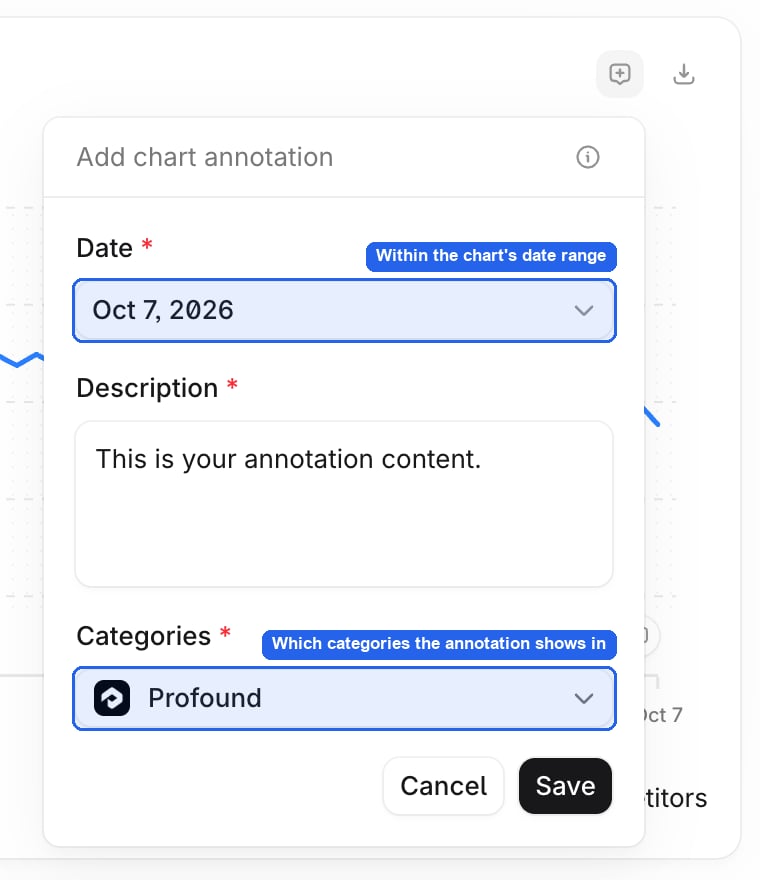 * **Date**: any date within the chart’s selected date range. To annotate a date outside the range, widen the date range first with the top-level filters.
* **Description**: what happened.
* **Categories**: where the annotation shows. By default it’s **All categories**, which applies to your whole organization, including categories you add later. To narrow it, select specific categories. The category you’re viewing is always included.
Select **Save**. Everyone in your organization who can view annotations sees it.
## Edit or delete an annotation
You can edit or delete only the annotations you added.
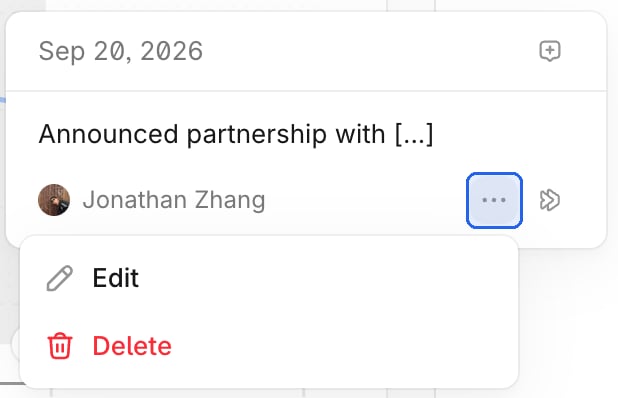
1. Open the annotation list and select **…** next to your annotation.
2. Select **Edit** to change the annotation, or select **Delete**. Deleting an annotation is permanent.
Platform updates and prompt updates can’t be edited or deleted.
* **Date**: any date within the chart’s selected date range. To annotate a date outside the range, widen the date range first with the top-level filters.
* **Description**: what happened.
* **Categories**: where the annotation shows. By default it’s **All categories**, which applies to your whole organization, including categories you add later. To narrow it, select specific categories. The category you’re viewing is always included.
Select **Save**. Everyone in your organization who can view annotations sees it.
## Edit or delete an annotation
You can edit or delete only the annotations you added.
1. Open the annotation list and select **…** next to your annotation.
2. Select **Edit** to change the annotation, or select **Delete**. Deleting an annotation is permanent.
Platform updates and prompt updates can’t be edited or deleted.
 ## Investigate an annotation with Aim
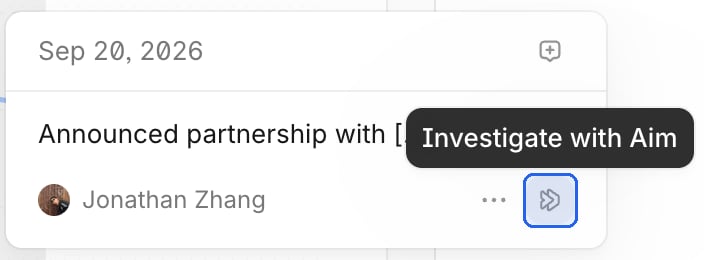
If you have access to Aim, select **Investigate with Aim** next to any annotation. Aim opens with the annotation and the chart you were viewing, and starts looking into how the event relates to that metric.
## Investigate an annotation with Aim
If you have access to Aim, select **Investigate with Aim** next to any annotation. Aim opens with the annotation and the chart you were viewing, and starts looking into how the event relates to that metric.
 Aim can also read your annotations when you ask about your Answer Engine Insights data.
## Permissions
Learn more in the [Roles and permissions](/platform-config/people/roles-and-permissions) documentation.
| Role | View annotations | Add, edit, and delete their own annotations | See prompt updates |
| - | - | - | - |
| Admin | ✅ | ✅ | ✅ |
| Editor | ✅ | ✅ | ❌ |
| Member | ✅ | ❌ | ❌ |
| Viewer - AEI Only | ✅ | ❌ | ❌ |
| Viewer - AEI + AI Marketer | ✅ | ❌ | ❌ |
| Agent Operator | ✅ | ❌ | ❌ |
Prompt updates come from [Activity Logs](/platform-config/activity-logs/about), which are available on the Enterprise plan, and need the **View Activity Logs** permission. Admins on the Enterprise plan can change these defaults with a custom role using the **View chart annotations** and **Create, edit, and delete custom chart annotations** permissions.
Annotations belong to your organization, and category-scoped annotations only show when viewing that category.
Aim can also read your annotations when you ask about your Answer Engine Insights data.
## Permissions
Learn more in the [Roles and permissions](/platform-config/people/roles-and-permissions) documentation.
| Role | View annotations | Add, edit, and delete their own annotations | See prompt updates |
| - | - | - | - |
| Admin | ✅ | ✅ | ✅ |
| Editor | ✅ | ✅ | ❌ |
| Member | ✅ | ❌ | ❌ |
| Viewer - AEI Only | ✅ | ❌ | ❌ |
| Viewer - AEI + AI Marketer | ✅ | ❌ | ❌ |
| Agent Operator | ✅ | ❌ | ❌ |
Prompt updates come from [Activity Logs](/platform-config/activity-logs/about), which are available on the Enterprise plan, and need the **View Activity Logs** permission. Admins on the Enterprise plan can change these defaults with a custom role using the **View chart annotations** and **Create, edit, and delete custom chart annotations** permissions.
Annotations belong to your organization, and category-scoped annotations only show when viewing that category.