> ## Documentation Index
> Fetch the complete documentation index at: https://docs.tryprofound.com/llms.txt
> Use this file to discover all available pages before exploring further.
# Interpret Answer Engine Insights
> Read the Visibility, Sentiment, FactCheck, Citations, and Prompts tabs in AEI
This article describes the redesigned Answer Engine Insights. To switch to the original design, go to [Answer Engine Insights settings](/answer-engine-insights/settings) > **Use legacy UI.**
Answer Engine Insights (AEI) breaks down your brand's performance across several analytical dimensions. Each dimension has its own tab in the top navigation: Visibility, Sentiment, FactCheck, Citations, and Prompts.
## Filters
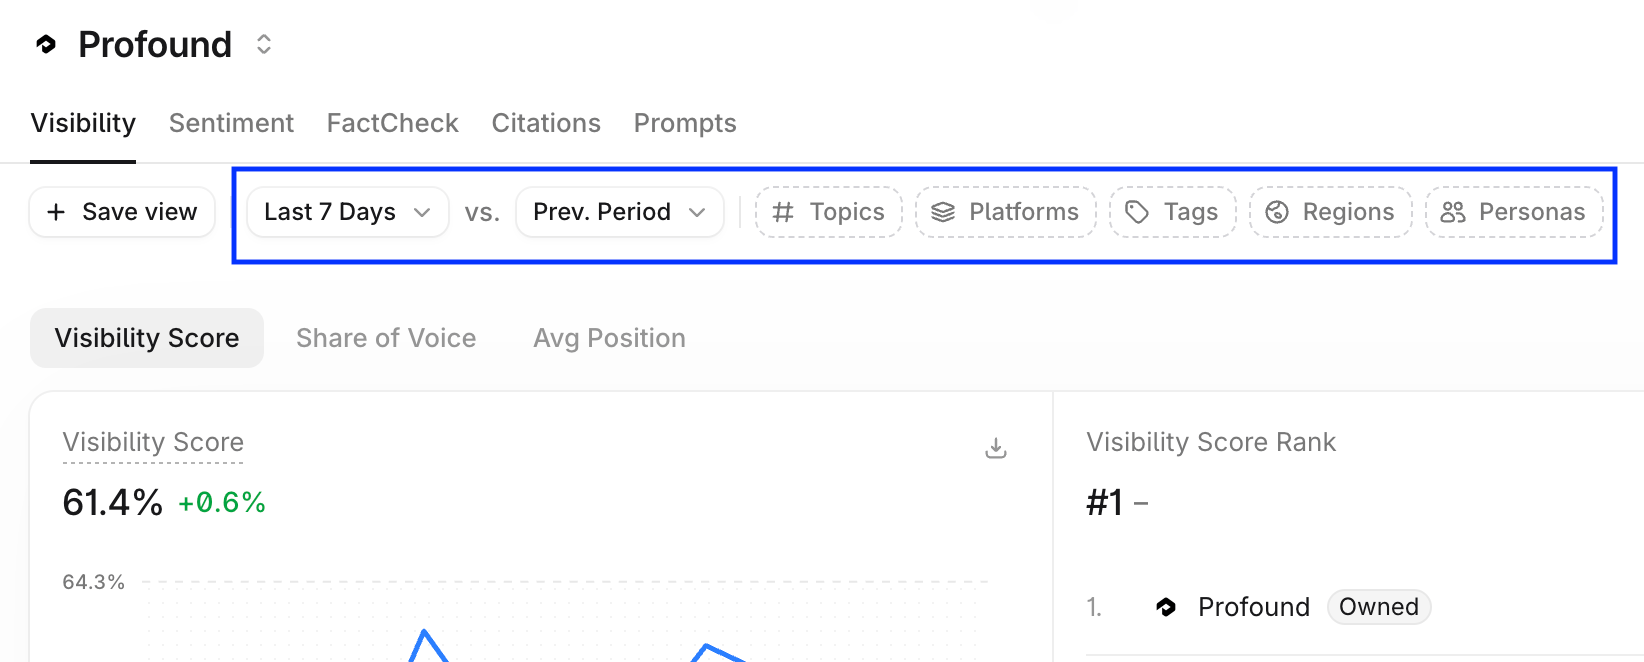
Filters are available throughout Answer Engine Insights. They allow you to adjust the analytical time frame, narrow the data view, and save views you return to often. Filters appear as dropdowns beneath the top navigation bar.
 ### Date range and comparison period
Use the date range filter to select the time window of the answer engine response collection. Choose a preset window (such as **Last 7 Days**) or define a custom range using the calendar selector.
After you select a time frame, only answer engine responses generated during that period appear in the charts.
Charts show change by comparing the selected time frame to a comparison period. Open the **Prev. Period** dropdown to choose how the comparison period is calculated:
* **Prev. Period**: the window immediately before the selected date range, of the same length.
* **Prev. Period Last Month**: the same window one month earlier.
* **Custom range**: any date range you define.
### Attribute filters
Attribute filters narrow the data shown on every chart in the current tab. To apply one, open the dropdown for the attribute (**Topics**, **Platforms**, **Tags**, **Regions**, **Competitors**, or **Languages**) and select the values to include. If your configuration uses [Personas](/answer-engine-insights/personas), a **Personas** filter is also available.
Use the **Competitors** filter on the Visibility tab to choose which of the brands you track appear in its charts and rank lists.
The Citations tab adds two filters of its own: **Prompt Type** and **Citation Categories**. Select **+** to add more filters to the bar.
### Save view
Select **Save view** to store the current combination of date range, comparison period, and filters. Saved views let you return to a specific analysis without rebuilding it each time.
### Export
Select **Export** in the top right of the tab to download the underlying data for the current filters. The Visibility, Sentiment, FactCheck, and Prompts tabs export answers. The Citations tab exports citations.
### Settings
Select the gear icon in the top right to open Answer Engine Insights settings. See the [Answer Engine Insights settings](/answer-engine-insights/settings) for details.
## The Compare dropdown
Most charts in Answer Engine Insights include a **Compare** dropdown in their top right corner.
### Date range and comparison period
Use the date range filter to select the time window of the answer engine response collection. Choose a preset window (such as **Last 7 Days**) or define a custom range using the calendar selector.
After you select a time frame, only answer engine responses generated during that period appear in the charts.
Charts show change by comparing the selected time frame to a comparison period. Open the **Prev. Period** dropdown to choose how the comparison period is calculated:
* **Prev. Period**: the window immediately before the selected date range, of the same length.
* **Prev. Period Last Month**: the same window one month earlier.
* **Custom range**: any date range you define.
### Attribute filters
Attribute filters narrow the data shown on every chart in the current tab. To apply one, open the dropdown for the attribute (**Topics**, **Platforms**, **Tags**, **Regions**, **Competitors**, or **Languages**) and select the values to include. If your configuration uses [Personas](/answer-engine-insights/personas), a **Personas** filter is also available.
Use the **Competitors** filter on the Visibility tab to choose which of the brands you track appear in its charts and rank lists.
The Citations tab adds two filters of its own: **Prompt Type** and **Citation Categories**. Select **+** to add more filters to the bar.
### Save view
Select **Save view** to store the current combination of date range, comparison period, and filters. Saved views let you return to a specific analysis without rebuilding it each time.
### Export
Select **Export** in the top right of the tab to download the underlying data for the current filters. The Visibility, Sentiment, FactCheck, and Prompts tabs export answers. The Citations tab exports citations.
### Settings
Select the gear icon in the top right to open Answer Engine Insights settings. See the [Answer Engine Insights settings](/answer-engine-insights/settings) for details.
## The Compare dropdown
Most charts in Answer Engine Insights include a **Compare** dropdown in their top right corner.
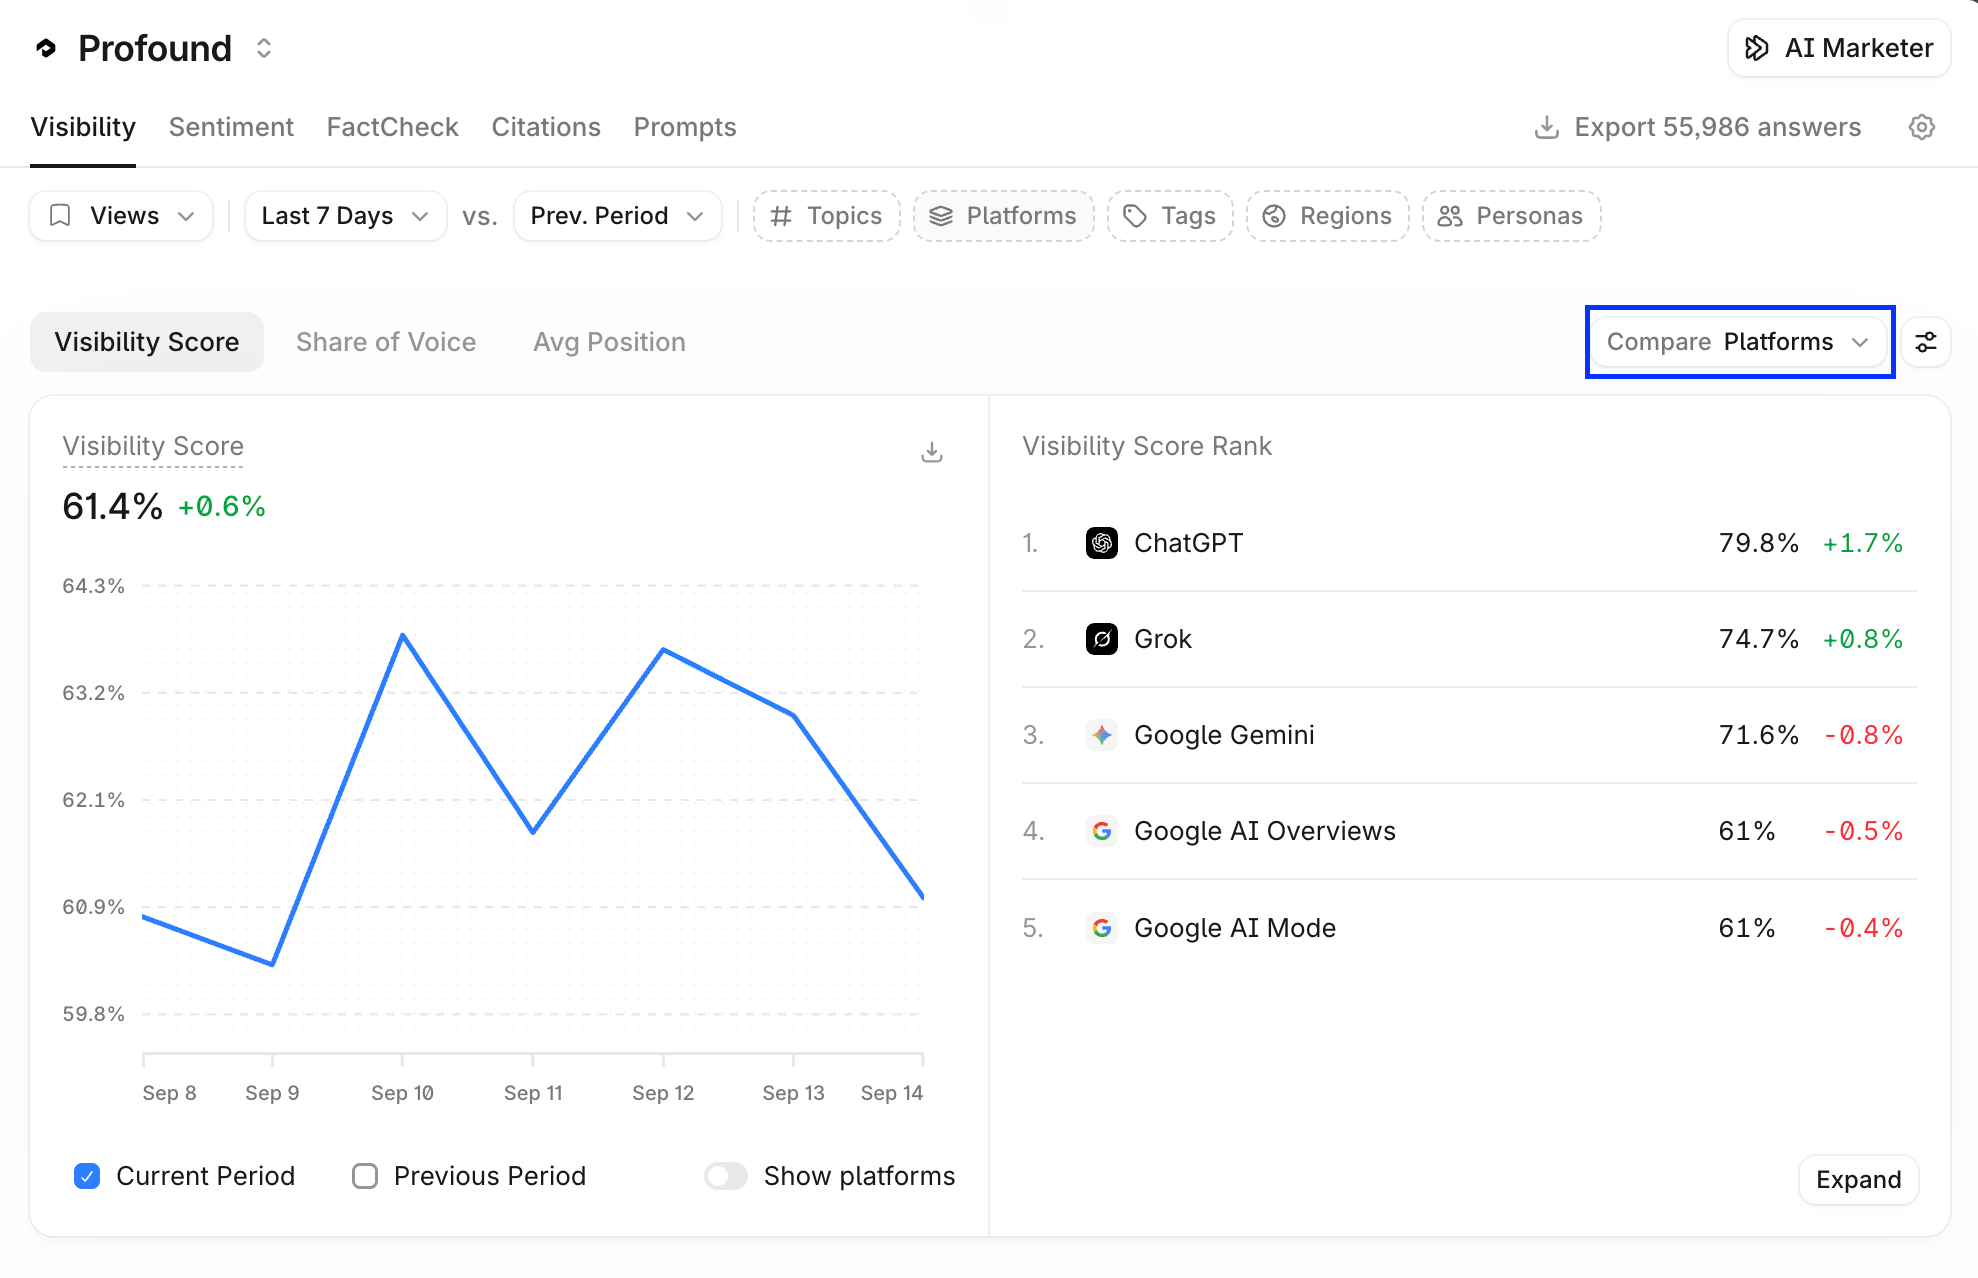 Use it to change how the chart breaks down data. The options are:
* **Competitors**: your brand and the brands you track, one line or row per brand. This is the default for the main Visibility chart.
* **Platforms**: one line or row per answer engine, such as ChatGPT, Perplexity, or Google AI Overviews.
* **Topics**: one line or row per topic.
* **Tags**: one line or row per prompt tag.
* **Regions**: one line or row per region you track.
* **Personas**: one line or row per Persona, if your configuration uses [Personas](/answer-engine-insights/personas).
For example, to see how your Visibility Score differs by platform, open the Visibility tab and set the **Compare** dropdown on the Visibility Score chart to **Platforms**. The rank list beside the chart then ranks platforms instead of brands.
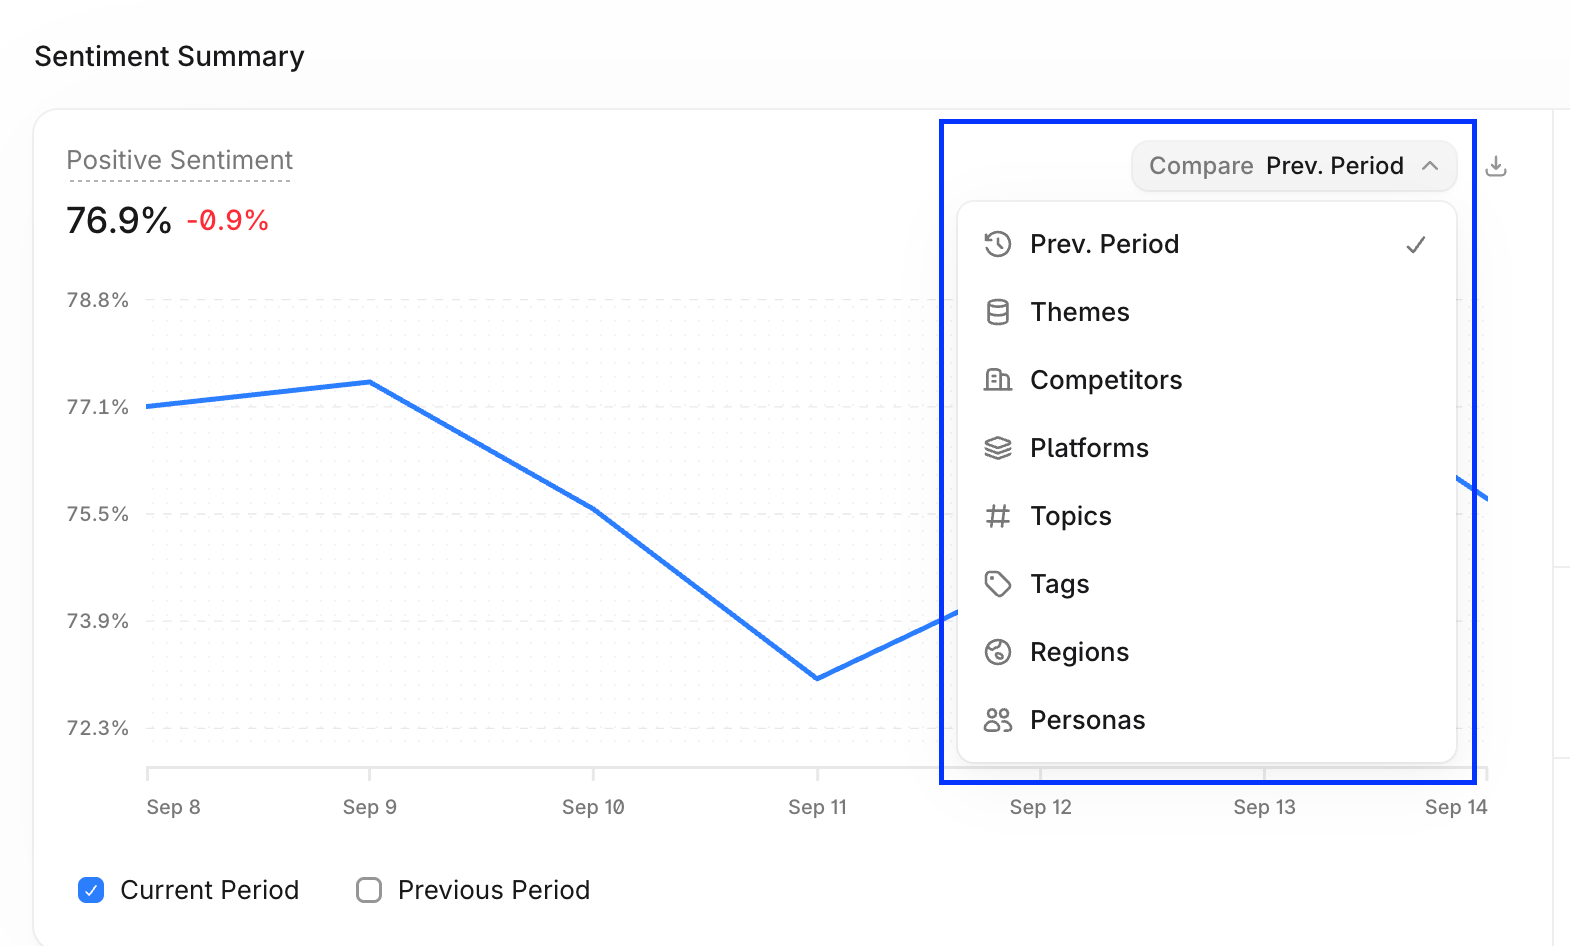
In the Sentiment and FactCheck tabs, the **Compare** dropdown has additional options: **Themes** and previous period comparison.
Use it to change how the chart breaks down data. The options are:
* **Competitors**: your brand and the brands you track, one line or row per brand. This is the default for the main Visibility chart.
* **Platforms**: one line or row per answer engine, such as ChatGPT, Perplexity, or Google AI Overviews.
* **Topics**: one line or row per topic.
* **Tags**: one line or row per prompt tag.
* **Regions**: one line or row per region you track.
* **Personas**: one line or row per Persona, if your configuration uses [Personas](/answer-engine-insights/personas).
For example, to see how your Visibility Score differs by platform, open the Visibility tab and set the **Compare** dropdown on the Visibility Score chart to **Platforms**. The rank list beside the chart then ranks platforms instead of brands.
In the Sentiment and FactCheck tabs, the **Compare** dropdown has additional options: **Themes** and previous period comparison.
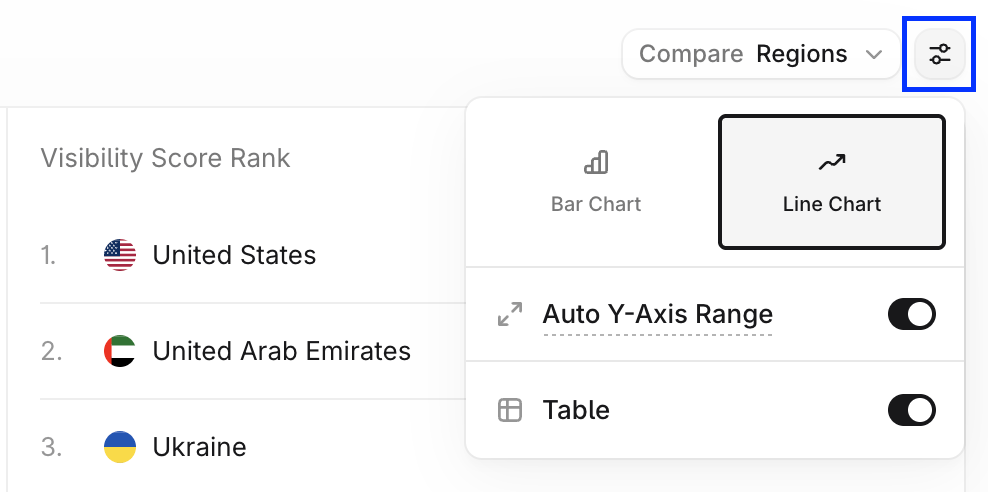
 Each chart has a chart settings icon next to the **Compare** dropdown. Use it to change how the chart visualizes data.
 ## Visibility
The **Visibility** tab breaks down your brand's presence in answer engine responses.
### Visibility Score, Share of Voice, and Average Position
The top chart has three sub-tabs that switch the metric: **Visibility Score**, **Share of Voice**, and **Avg Position**.
## Visibility
The **Visibility** tab breaks down your brand's presence in answer engine responses.
### Visibility Score, Share of Voice, and Average Position
The top chart has three sub-tabs that switch the metric: **Visibility Score**, **Share of Voice**, and **Avg Position**.
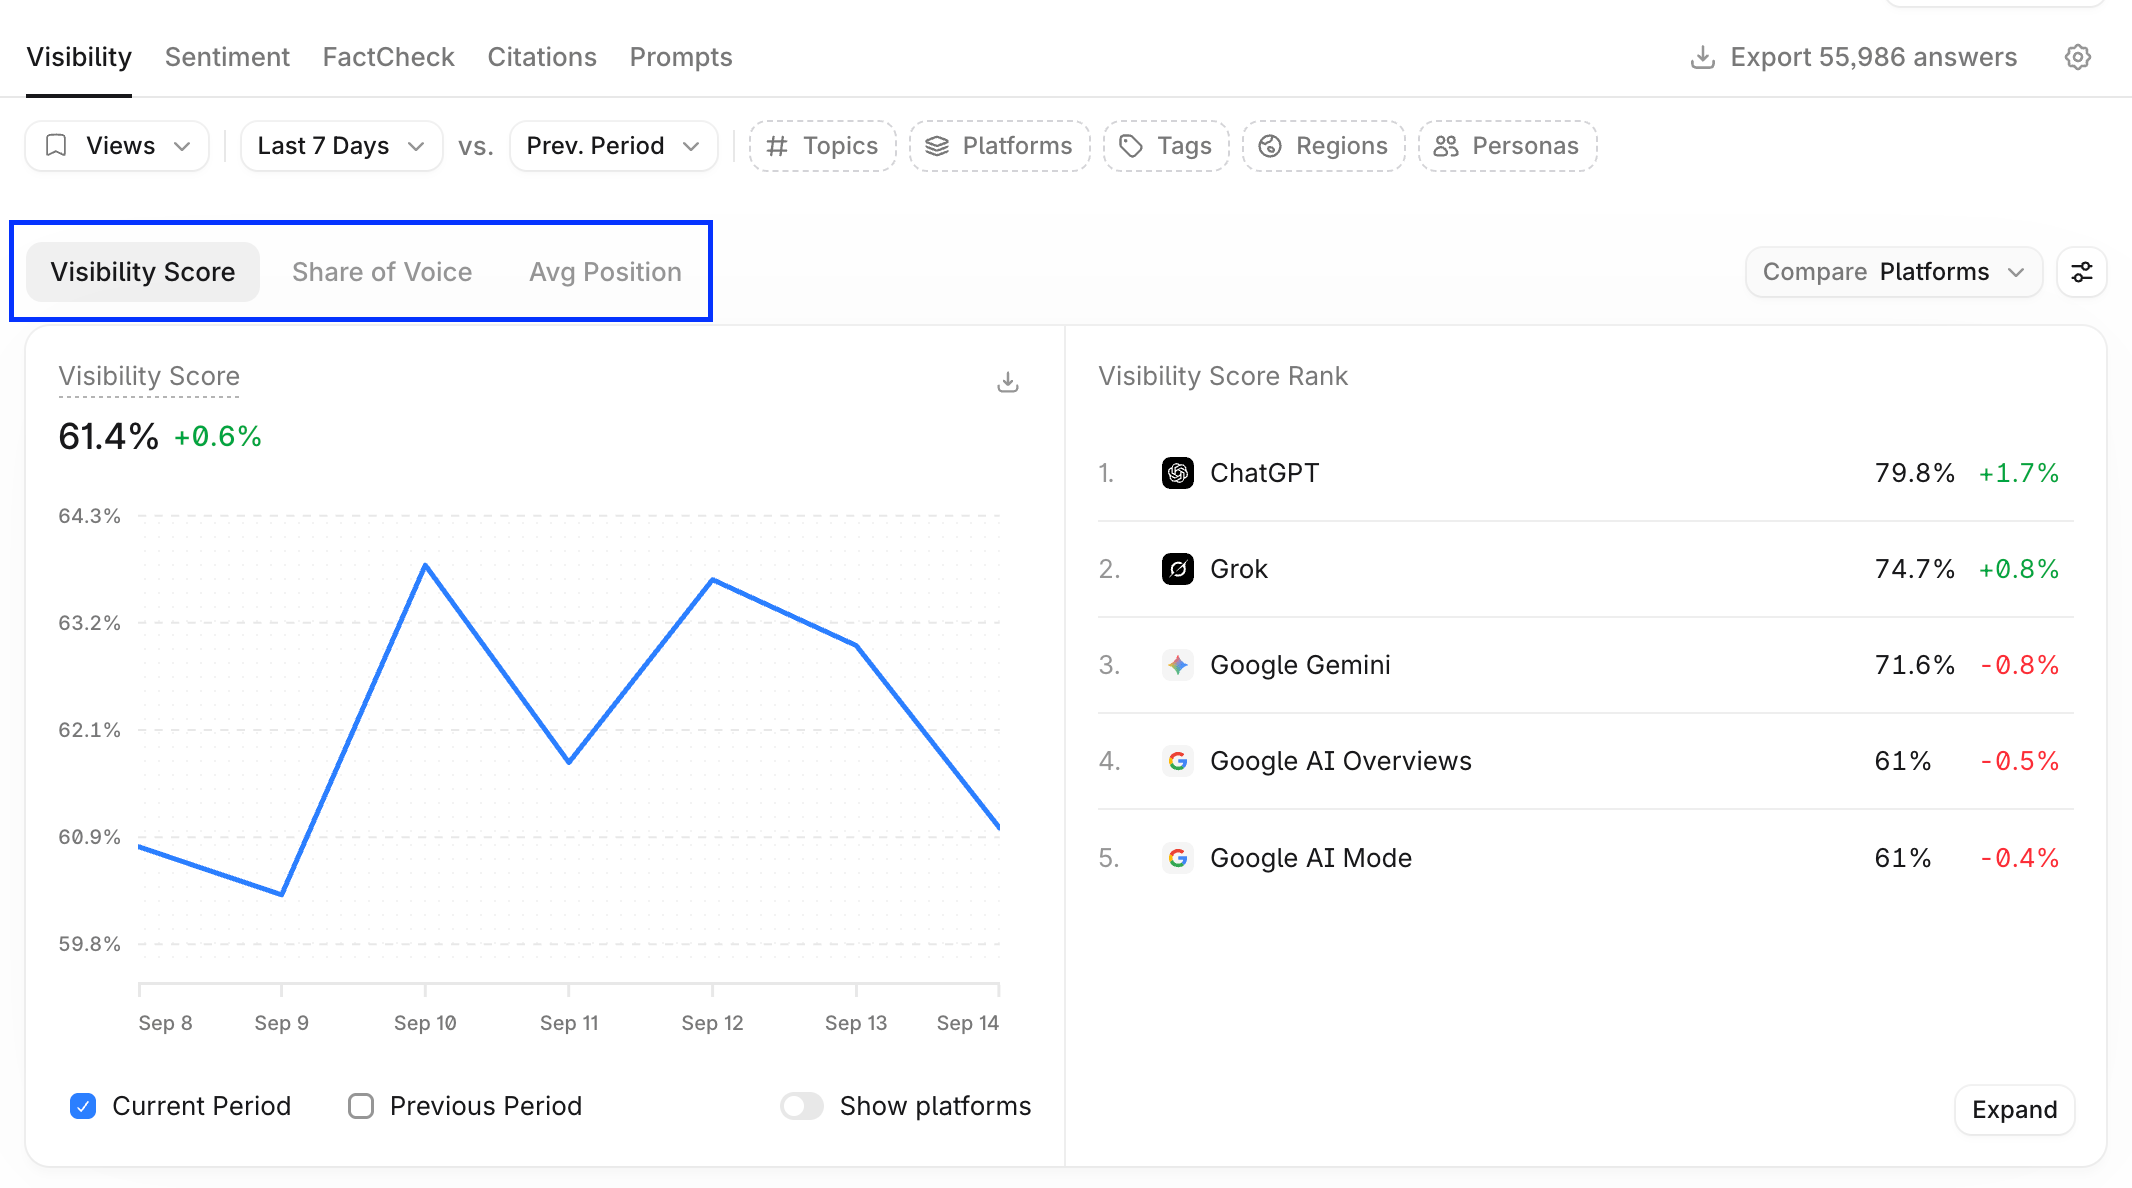 Each metric appears as a line chart and a rank list.
* The line chart shows the metric over the selected date range. Select **Current Period** or **Previous Period** at the bottom of the chart to show or hide either line, and toggle the **Show ...** option to overlay the brands you track.
* The rank list shows your brand's rank by the selected metric relative to competitors, with the change versus the comparison period. Select **Expand** to see the full list. When the chart compares topics or tags, select a row to open that topic or tag's subpage.
Use the **Compare** dropdown to pivot the chart and rank list by platforms, topics, tags, regions, or Personas.
### Visibility Trends
**Visibility Trends** shows the largest movements in Visibility Score during the selected period, split into **Biggest Spikes** and **Biggest Drops**. Each item shows a sparkline, the current score, and the change versus the comparison period.
Each metric appears as a line chart and a rank list.
* The line chart shows the metric over the selected date range. Select **Current Period** or **Previous Period** at the bottom of the chart to show or hide either line, and toggle the **Show ...** option to overlay the brands you track.
* The rank list shows your brand's rank by the selected metric relative to competitors, with the change versus the comparison period. Select **Expand** to see the full list. When the chart compares topics or tags, select a row to open that topic or tag's subpage.
Use the **Compare** dropdown to pivot the chart and rank list by platforms, topics, tags, regions, or Personas.
### Visibility Trends
**Visibility Trends** shows the largest movements in Visibility Score during the selected period, split into **Biggest Spikes** and **Biggest Drops**. Each item shows a sparkline, the current score, and the change versus the comparison period.
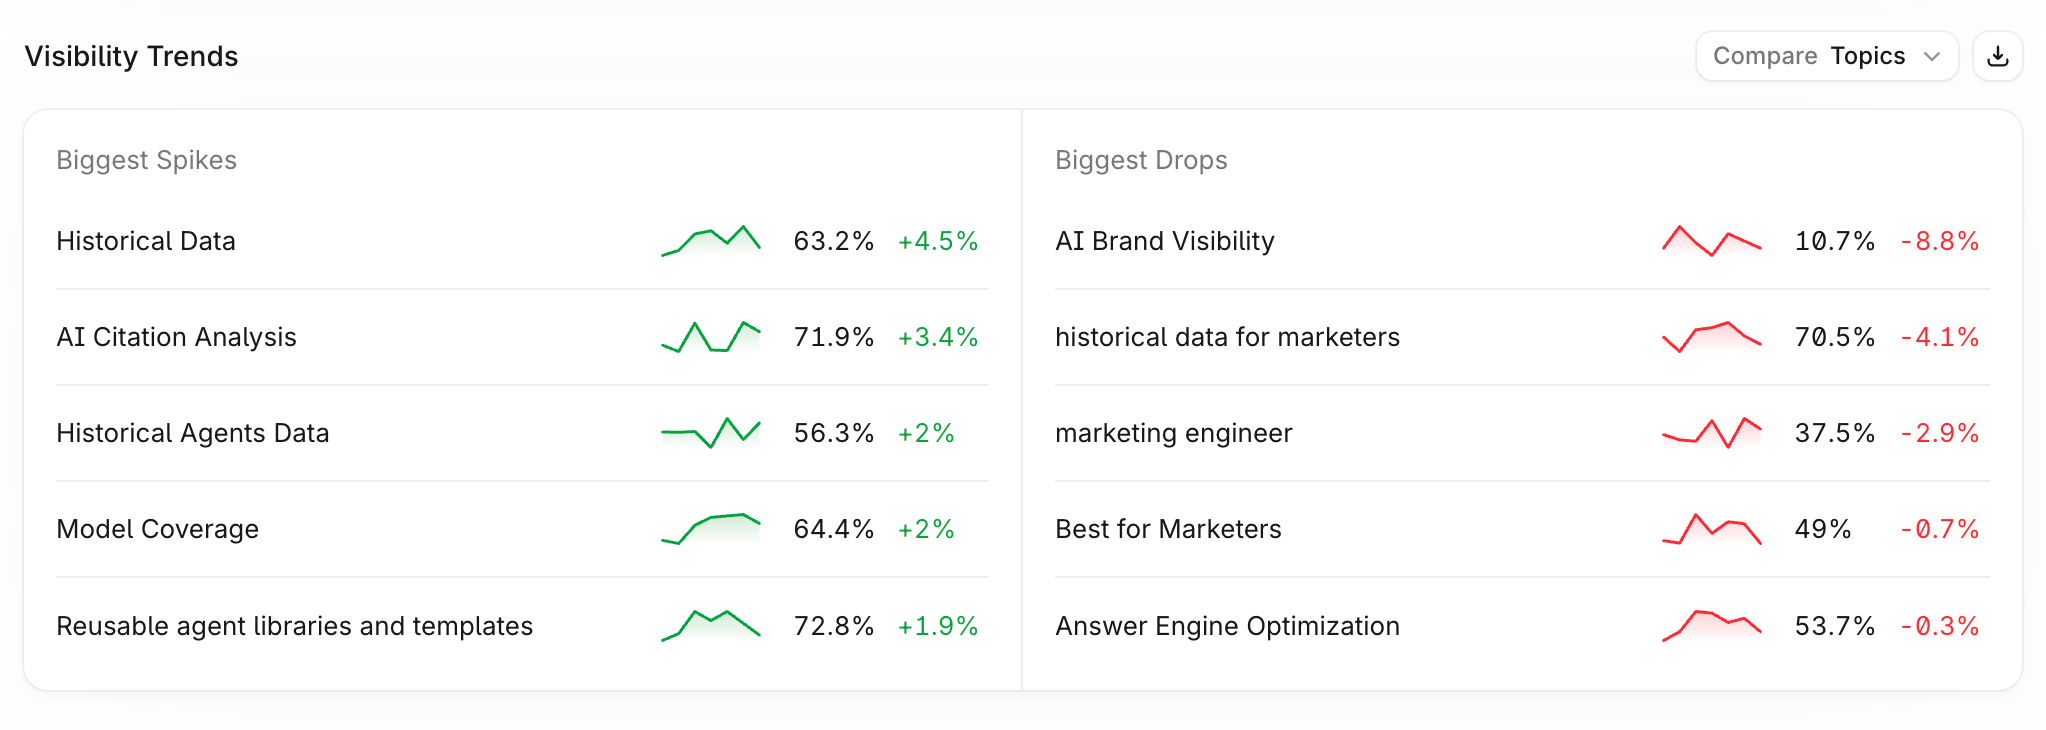 By default the trends compare topics. Use the **Compare** dropdown to see the biggest movers across competitors, platforms, tags, regions, or Personas instead.
### Visibility Ranking
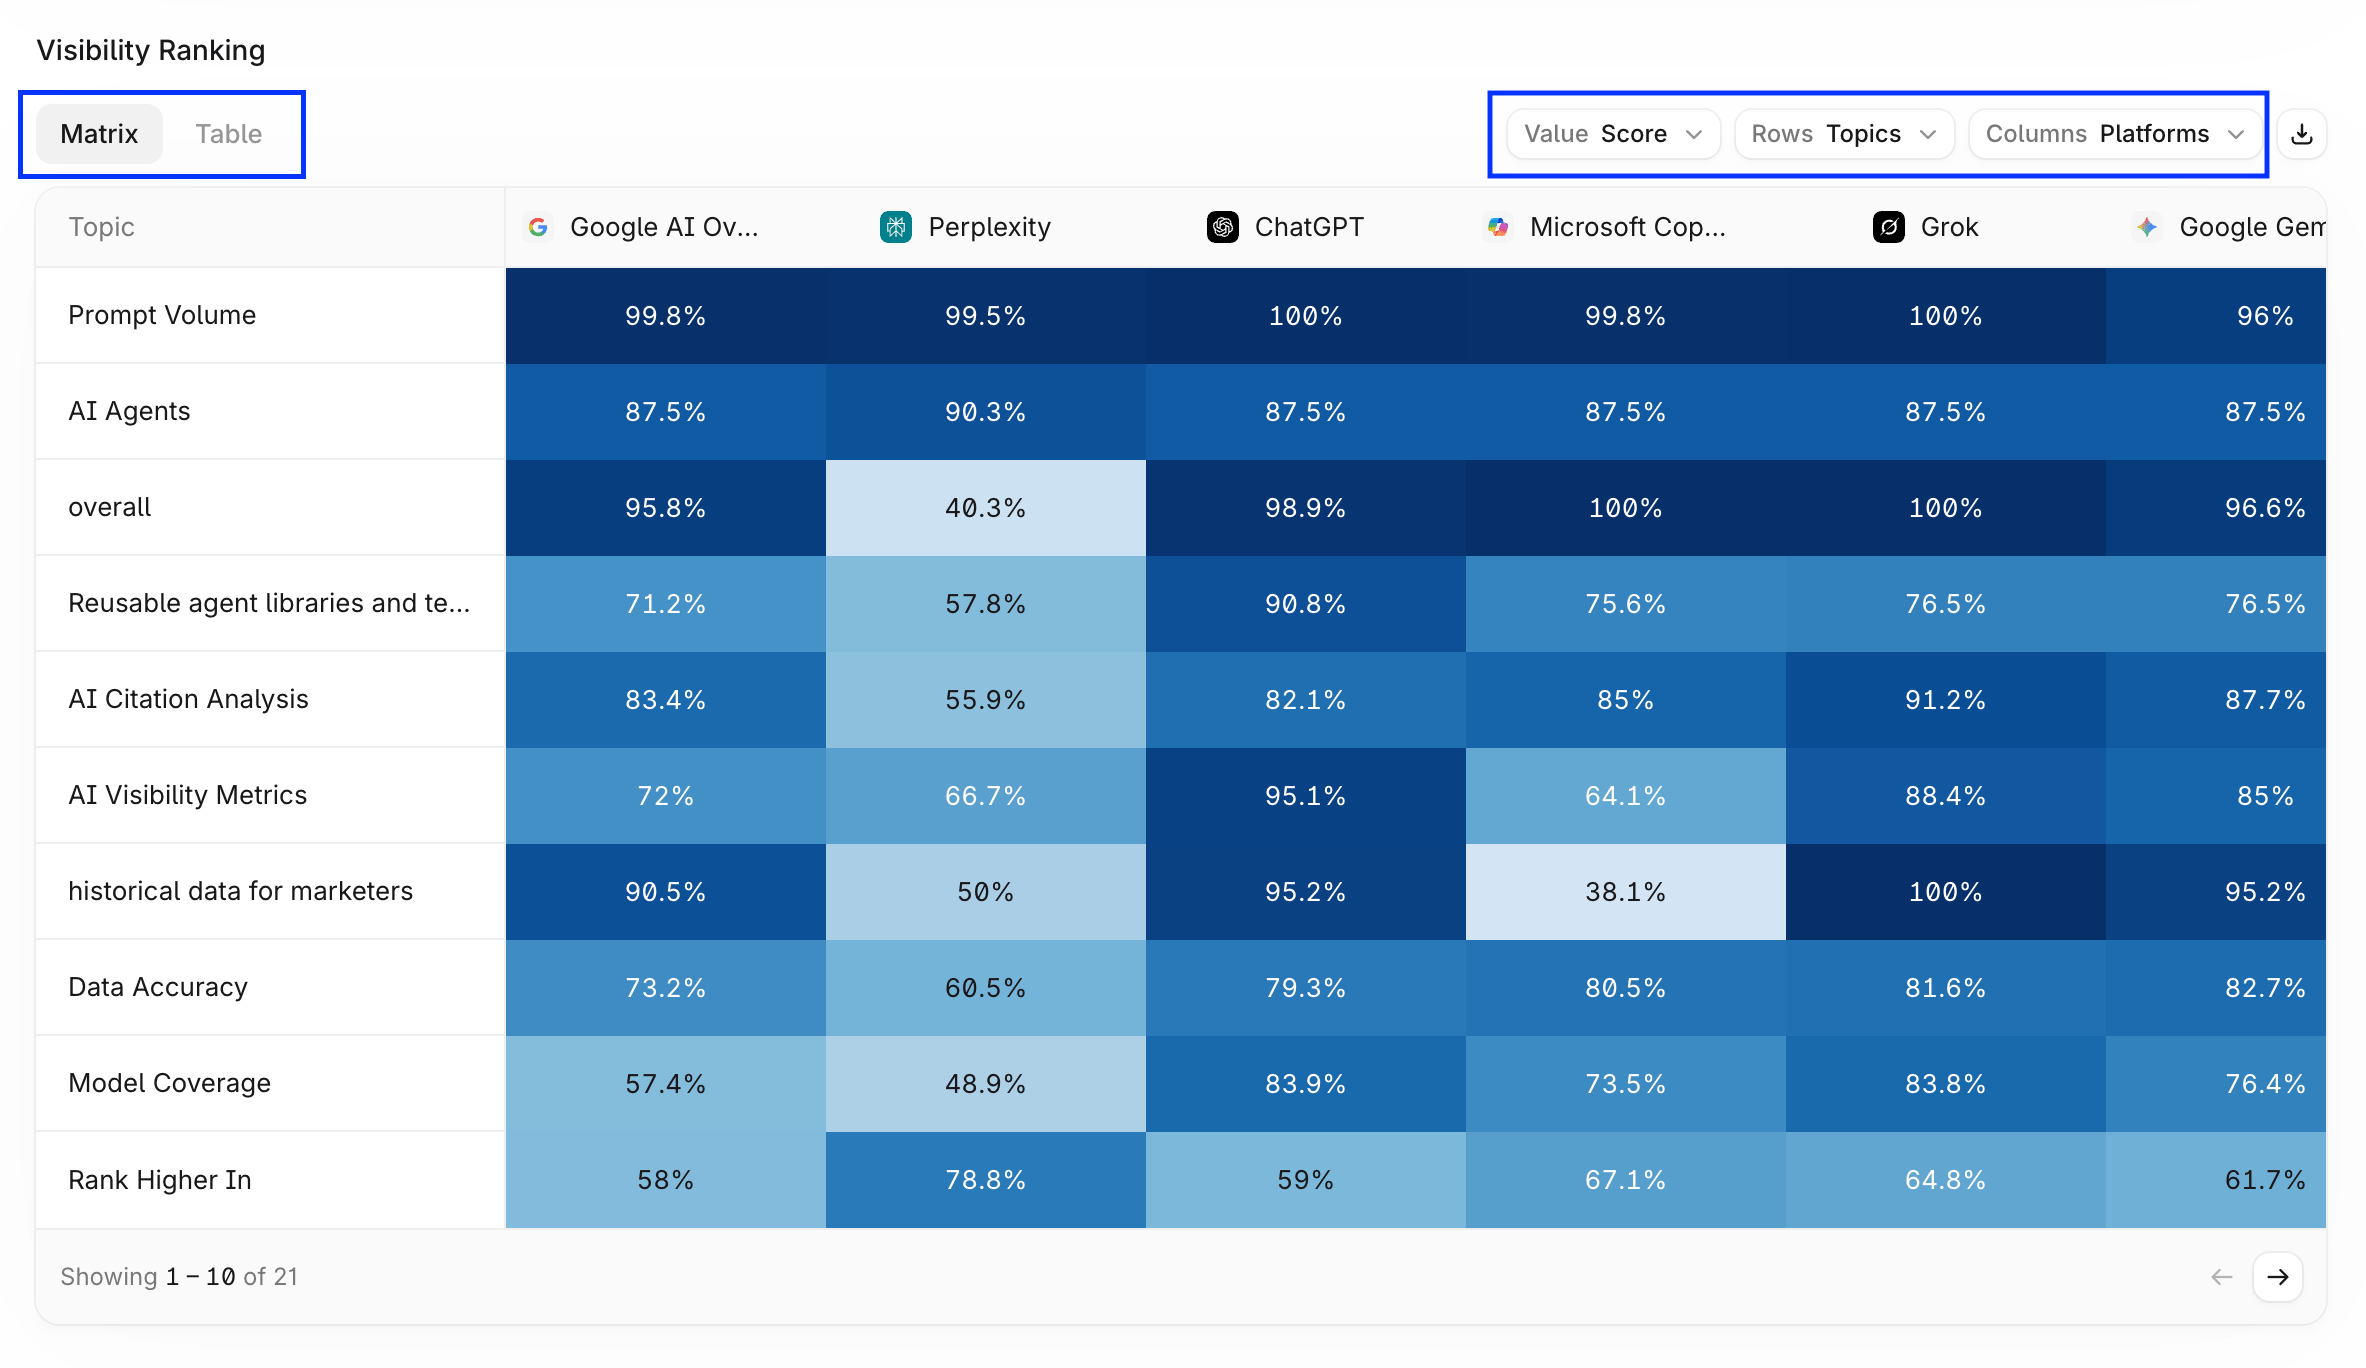
Visibility Ranking is a customizable heat map that shows how two dimensions intersect, for example how each platform performs in each topic. Configure it with the controls above the table:
* **Value**: show the Visibility Score as a percentage, or show rank instead.
* **Rows**: the dimension shown as rows, such as topics, tags, regions, or platforms.
* **Columns**: the dimension shown as columns, such as competitors or platforms.
Darker cells indicate higher values.
By default the trends compare topics. Use the **Compare** dropdown to see the biggest movers across competitors, platforms, tags, regions, or Personas instead.
### Visibility Ranking
Visibility Ranking is a customizable heat map that shows how two dimensions intersect, for example how each platform performs in each topic. Configure it with the controls above the table:
* **Value**: show the Visibility Score as a percentage, or show rank instead.
* **Rows**: the dimension shown as rows, such as topics, tags, regions, or platforms.
* **Columns**: the dimension shown as columns, such as competitors or platforms.
Darker cells indicate higher values.
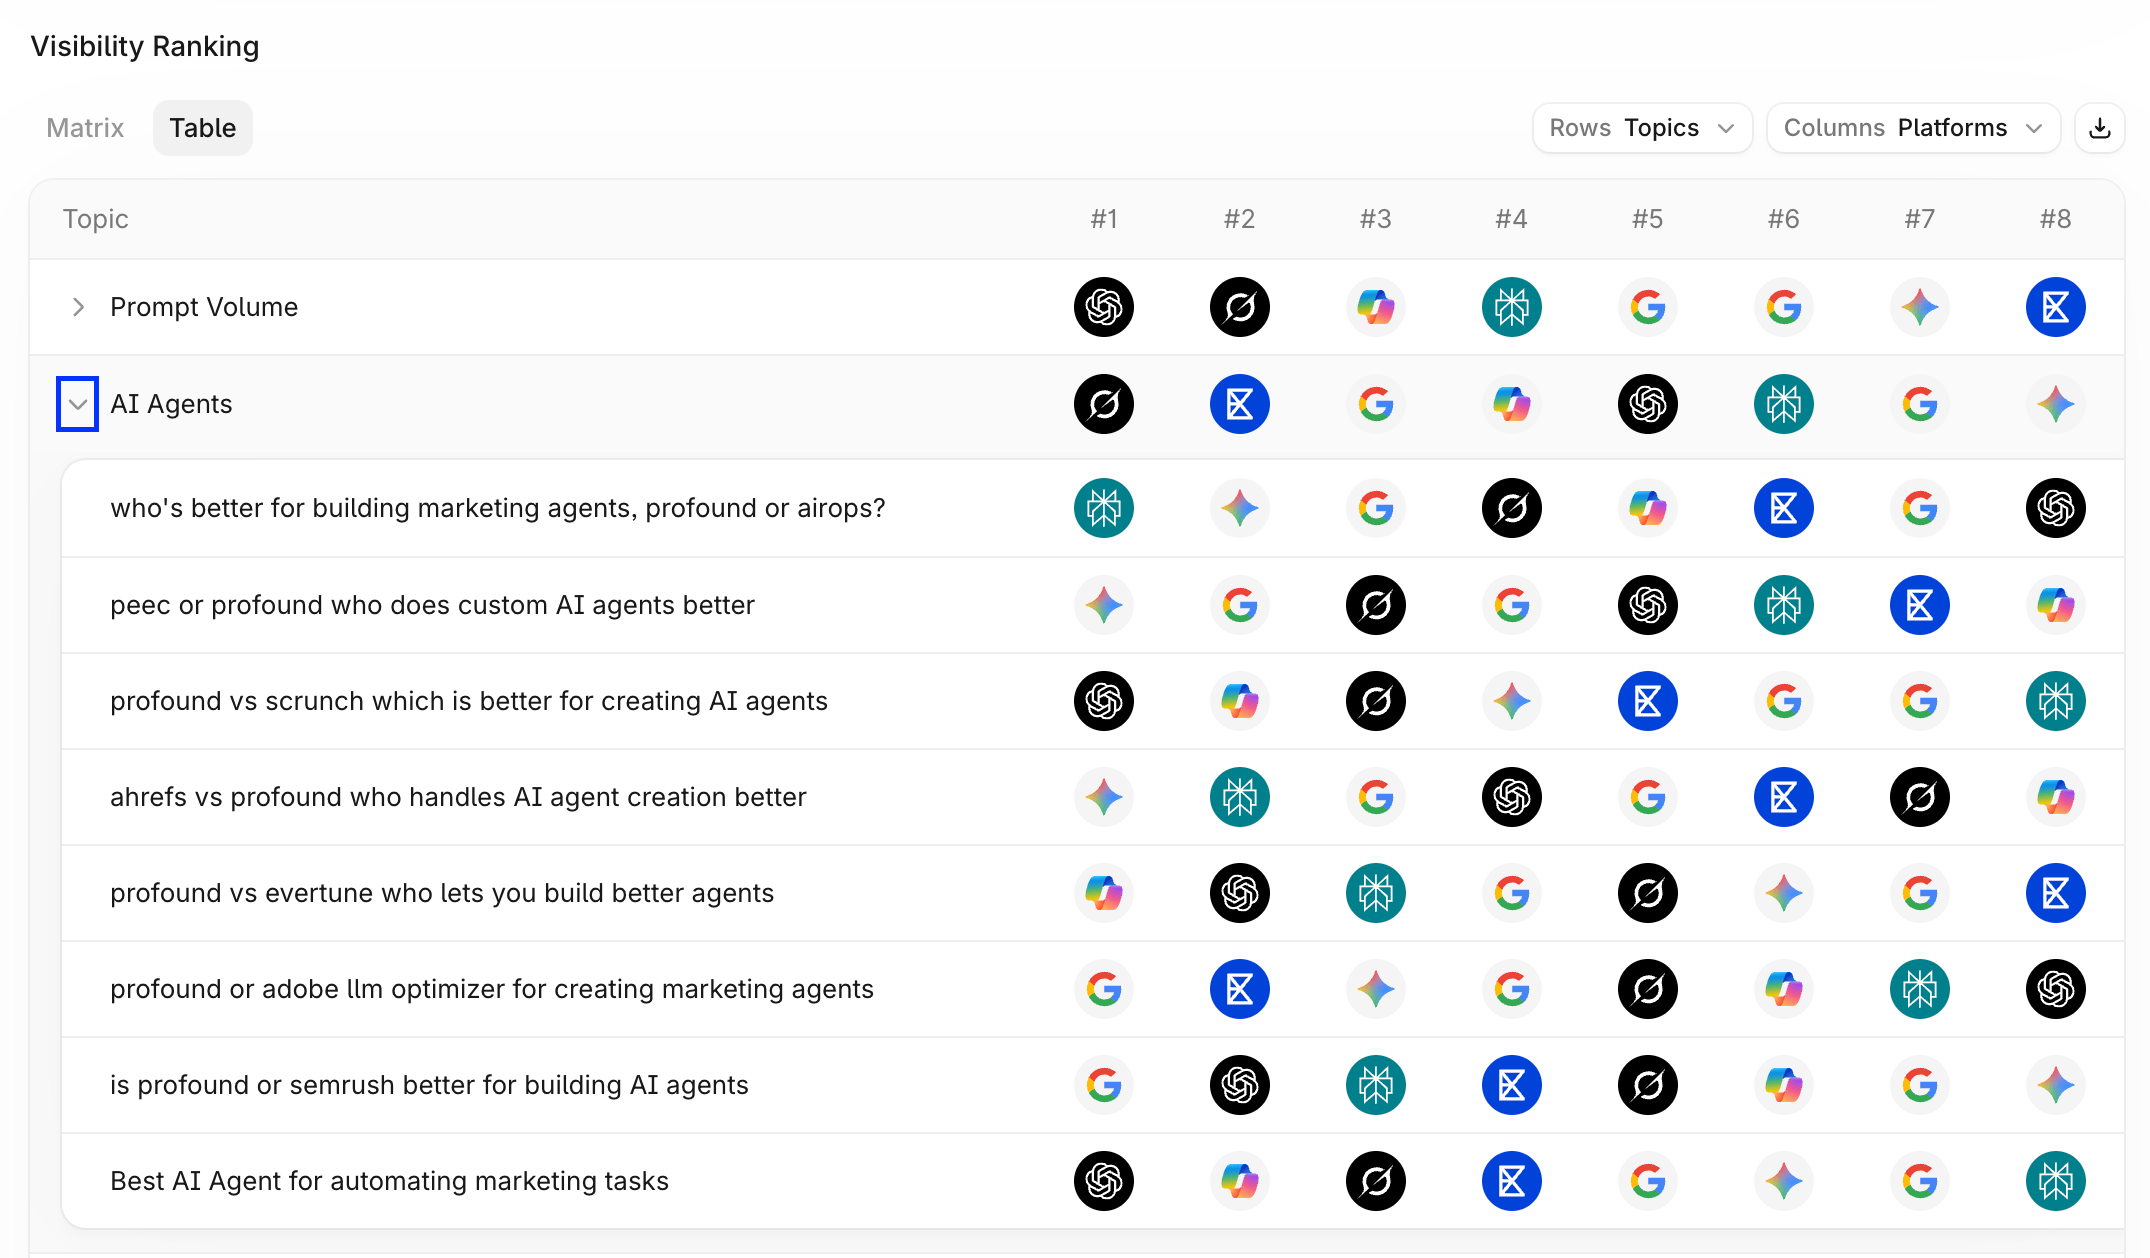
 Select **Table** to view the same data in a standard rank table. Expand the topics to see the ranking of their prompts. Select a prompt to open it's Prompt Analysis view with visibility metrics, executions and citations.
 ### Topic Prioritization
Topic Prioritization plots each topic by its Visibility Score and Citation Share so you can decide where to focus.
### Topic Prioritization
Topic Prioritization plots each topic by its Visibility Score and Citation Share so you can decide where to focus.
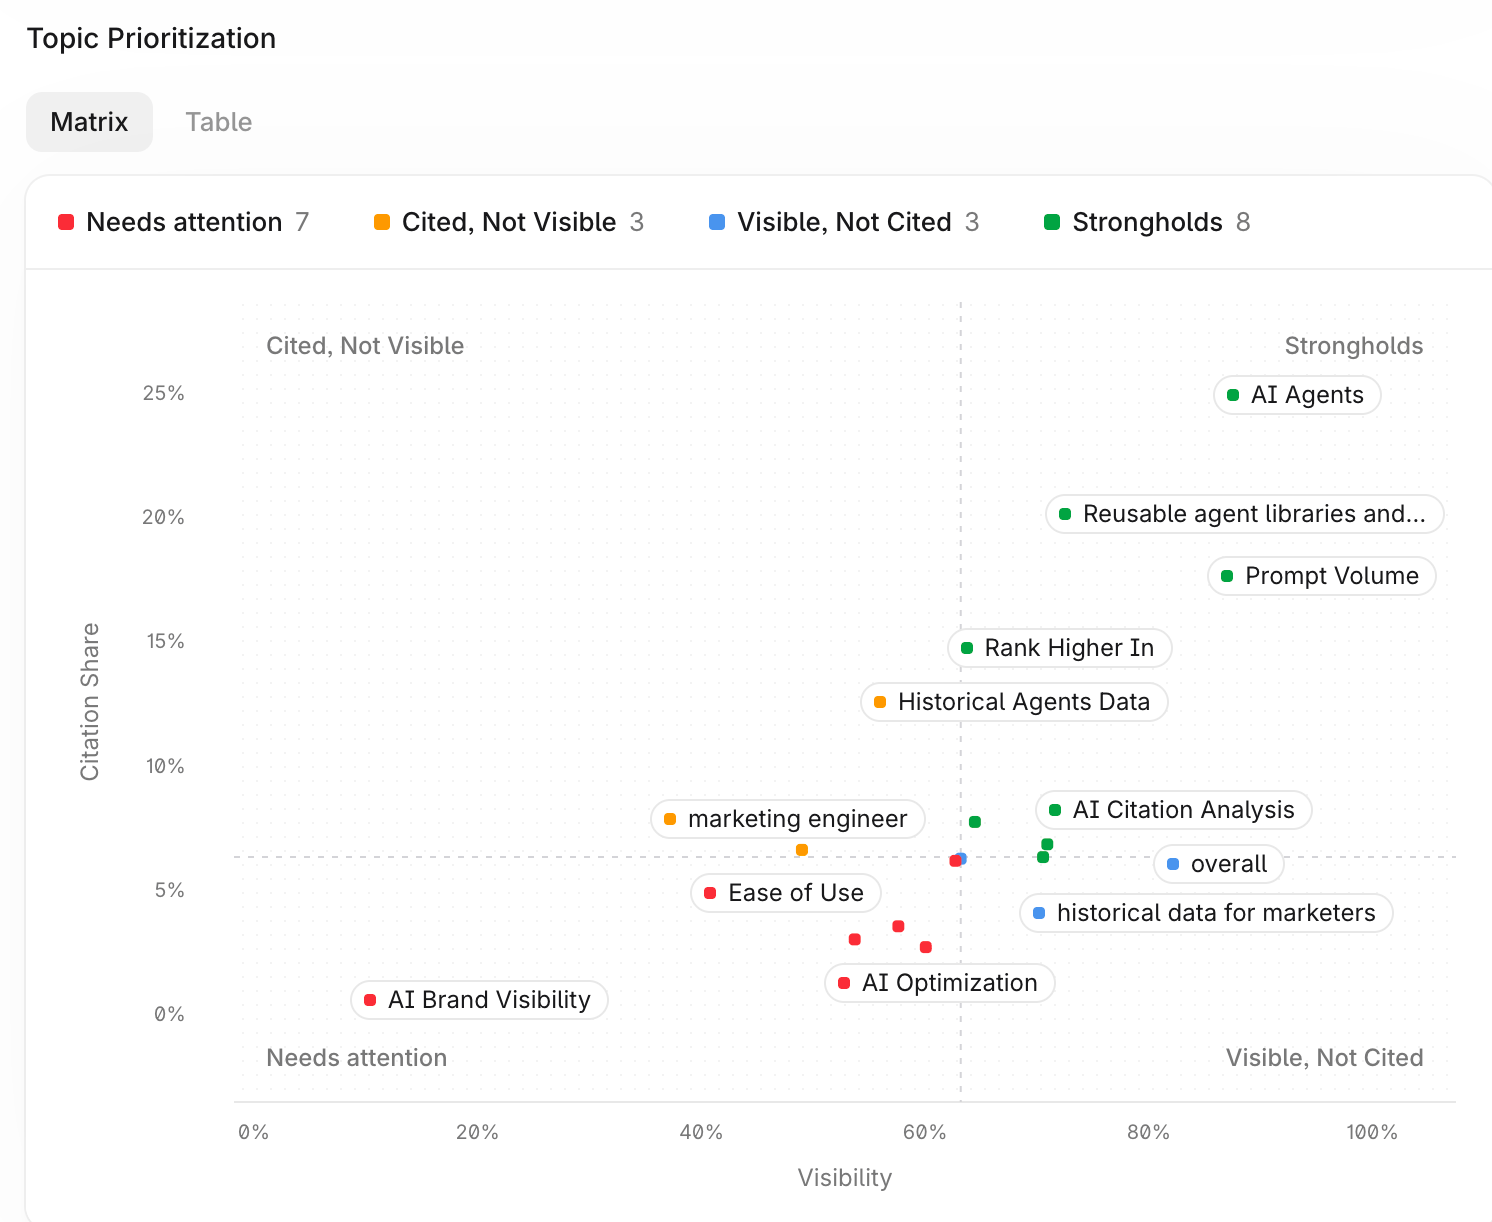 The matrix splits topics into four groups:
| Group | What it means |
| - | - |
| Strongholds | High visibility and high citation share. Maintain your position. |
| Needs attention | Low visibility and low citation share. Content and citation work are both needed. |
| Cited, Not Visible | Your content is cited, but your brand isn't mentioned in the answer. Review how the cited pages present your brand. |
| Visible, Not Cited | Your brand is mentioned, but answer engines cite other sources. Build content that answer engines can cite. |
Select **Table** above the plot to view the same data as a ranked list.
## Citations
The **Citations** tab assesses how often answer engine responses cite your domains, and which other sources they rely on.
### Citation Share and Citation Coverage
The top chart has two sub-tabs that switch the metric: **Citation Share** and **Citation Coverage**.
The matrix splits topics into four groups:
| Group | What it means |
| - | - |
| Strongholds | High visibility and high citation share. Maintain your position. |
| Needs attention | Low visibility and low citation share. Content and citation work are both needed. |
| Cited, Not Visible | Your content is cited, but your brand isn't mentioned in the answer. Review how the cited pages present your brand. |
| Visible, Not Cited | Your brand is mentioned, but answer engines cite other sources. Build content that answer engines can cite. |
Select **Table** above the plot to view the same data as a ranked list.
## Citations
The **Citations** tab assesses how often answer engine responses cite your domains, and which other sources they rely on.
### Citation Share and Citation Coverage
The top chart has two sub-tabs that switch the metric: **Citation Share** and **Citation Coverage**.
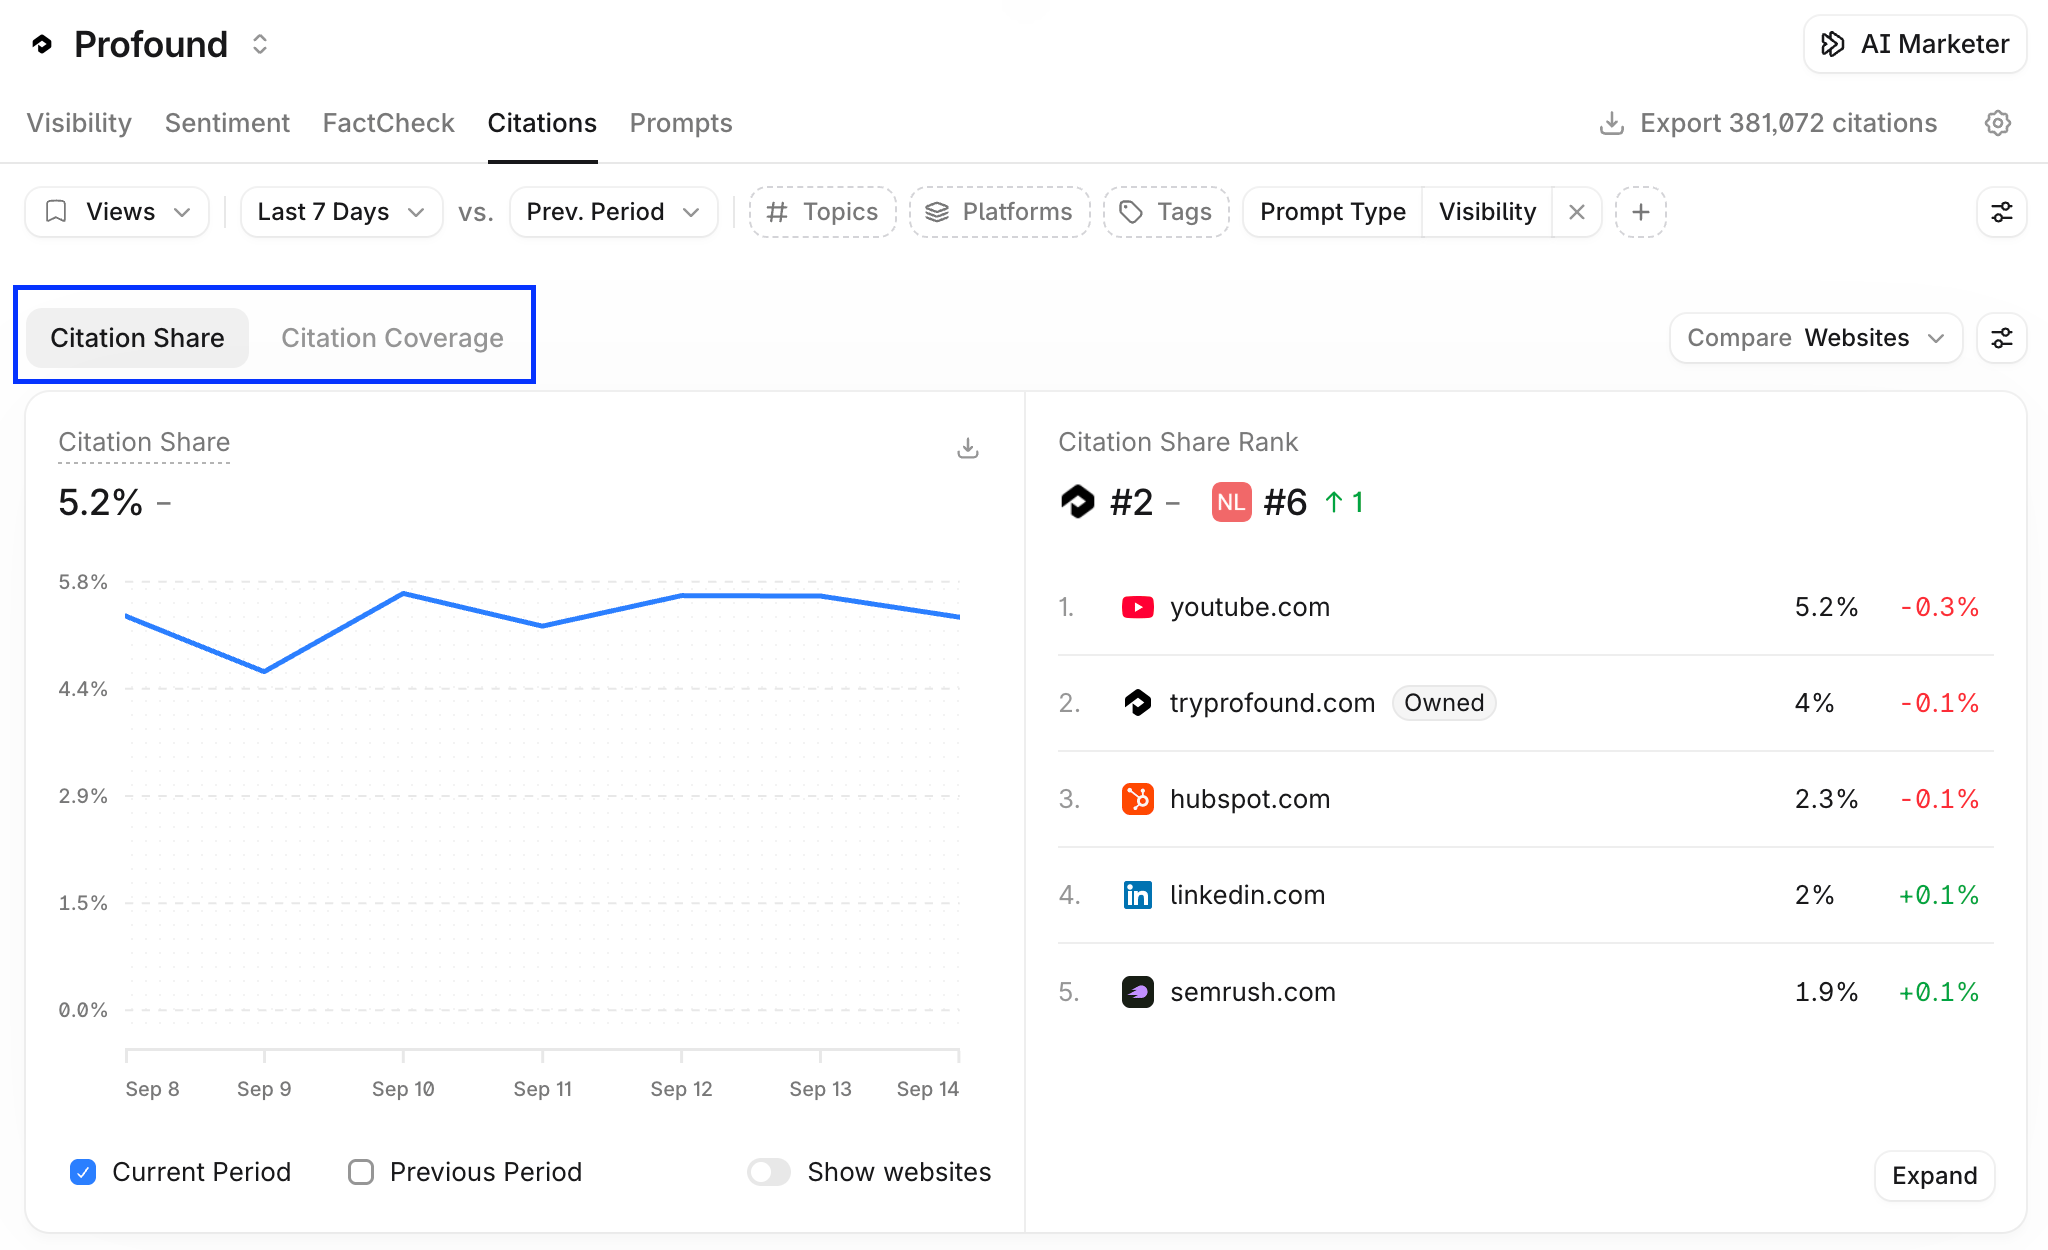 Each metric is displayed as a line chart and a rank list.
* The line chart shows the metric over the selected date range. Select **Current Period** or **Previous Period** at the bottom of the chart to show or hide either line, and toggle the **Show ...** option to overlay other domains.
* The **Citation Share Rank** list ranks the most cited domains, with your owned domains marked **Owned**. Select **Expand** below the table to see the full list.
By default the chart compares websites. Use the **Compare** dropdown to pivot by platforms, topics, tags, regions, or Personas.
### Citation Categories
Citation Categories classify the sources AI platforms cite, helping you understand where your visibility comes from and identify opportunities.
The **Citation Share by Category** chart shows the share of citations for each category. Use the chart settings on the top right of the chart to switch to a line chart and see how each category trends over time.
Each metric is displayed as a line chart and a rank list.
* The line chart shows the metric over the selected date range. Select **Current Period** or **Previous Period** at the bottom of the chart to show or hide either line, and toggle the **Show ...** option to overlay other domains.
* The **Citation Share Rank** list ranks the most cited domains, with your owned domains marked **Owned**. Select **Expand** below the table to see the full list.
By default the chart compares websites. Use the **Compare** dropdown to pivot by platforms, topics, tags, regions, or Personas.
### Citation Categories
Citation Categories classify the sources AI platforms cite, helping you understand where your visibility comes from and identify opportunities.
The **Citation Share by Category** chart shows the share of citations for each category. Use the chart settings on the top right of the chart to switch to a line chart and see how each category trends over time.
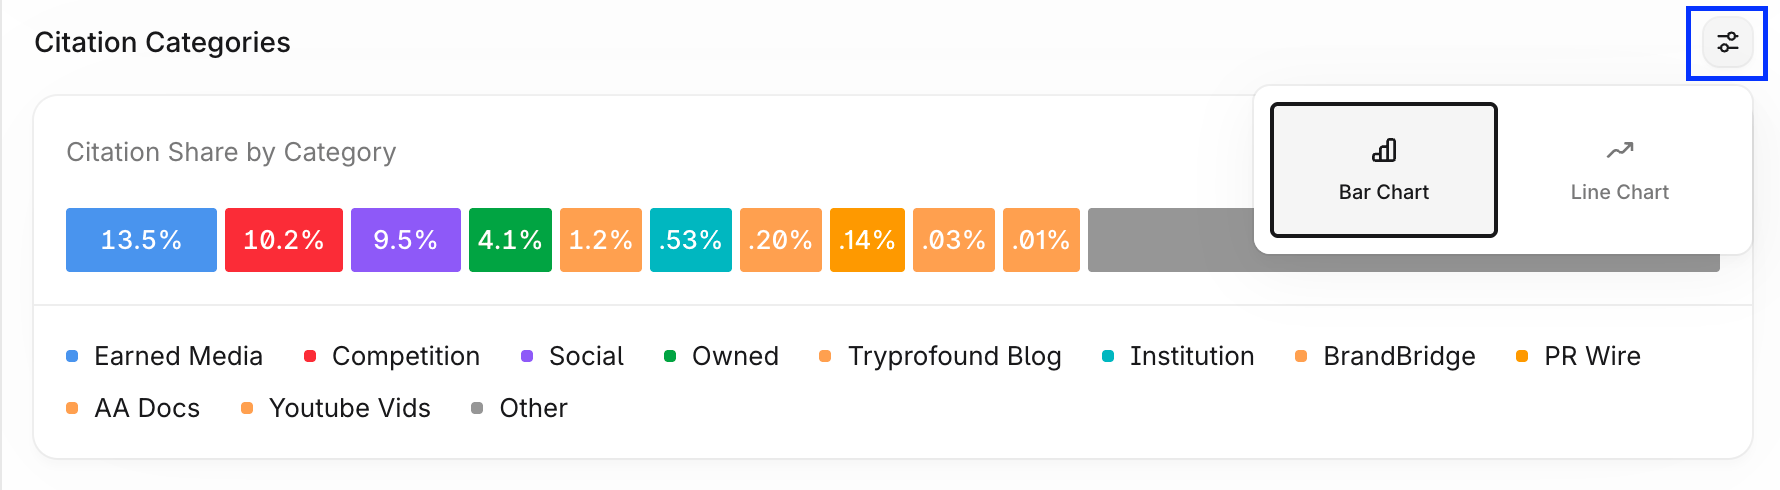 **Owned**, **Competition**, and **Custom** categories are defined in [Answer Engine Insights settings](/answer-engine-insights/settings). All other categories are assigned automatically but can be overridden in settings.
| **Category** | **Definition** | **Includes** |
| - | - | - |
| Owned | Websites and digital properties directly owned, controlled, or managed by your brand or its related entities. | Primary domains, subdomains, product microsites, help centers, documentation sites |
| Competition | Websites belonging to or controlled by competitors your brand tracks. | Competitor homepages, blogs, press sections, resource pages |
| Earned Media | Sites whose primary purpose is publishing content. A marketer can identify a site owner, editor, or publisher to partner with. Content is the product, monetized via ads, affiliate revenue, or subscriptions. Does not include corporate blogs, company newsrooms, or lead generation sites. | News outlets, magazines, trade publications, editorial review sites (Wirecutter, PCMag), affiliate and comparison sites (NerdWallet, Investopedia), broadcast media, contributor-model publications (Forbes, HuffPost), personal blogs |
| PR Wire | Press release distribution services that syndicate company announcements to media outlets. | PR Newswire, Business Wire, GlobeNewswire, Accesswire, and other major PR wires |
| Institution | Government, educational, research, or public-interest nonprofit organizations. Institutional TLDs are auto-classified: .gov, .edu, .mil, .int, .gov.*, .ac.*, .nhs.*, .gouv.*, .gob. | Government sites, universities, research institutions, academic publishers (Nature, arXiv), international bodies (UN, WHO), professional associations (ABA, AMA), mission-driven nonprofits (Red Cross, UNICEF), Wikipedia |
| Social | Platforms where users publish freely and visibility is determined by votes, algorithms, or follower graphs. Does not include vendor-owned support forums or e-commerce product reviews. | Social networks (Facebook, Instagram, X/Twitter, TikTok, LinkedIn), video platforms (YouTube), discussion platforms (Reddit, Discord), Q\&A platforms (Quora, Stack Overflow), open publishing platforms (Medium, Substack), consumer review aggregators (Yelp, TripAdvisor), B2B review aggregators (G2, Capterra, TrustRadius) |
| Other | Sources that don't fit the above categories, typically where content exists to support selling products or services. Domains with fewer than 100 total citations are also classified as Other. | Corporate websites, SaaS, e-commerce, service businesses, company blogs and newsrooms, vendor-owned forums, marketplaces (Airbnb, Etsy), course platforms (Coursera, Udemy), job boards, directories, industry trade groups, lead generation sites |
| Custom | Categories you create to track specific domains or pages. | Any domains or pages you specify |
### All Citations
All Citations is a ranked table of every cited source in the selected period.
Use the search box above the table to find a domain or page, the settings icon to adjust the table, and the download icon to export it.
**Owned**, **Competition**, and **Custom** categories are defined in [Answer Engine Insights settings](/answer-engine-insights/settings). All other categories are assigned automatically but can be overridden in settings.
| **Category** | **Definition** | **Includes** |
| - | - | - |
| Owned | Websites and digital properties directly owned, controlled, or managed by your brand or its related entities. | Primary domains, subdomains, product microsites, help centers, documentation sites |
| Competition | Websites belonging to or controlled by competitors your brand tracks. | Competitor homepages, blogs, press sections, resource pages |
| Earned Media | Sites whose primary purpose is publishing content. A marketer can identify a site owner, editor, or publisher to partner with. Content is the product, monetized via ads, affiliate revenue, or subscriptions. Does not include corporate blogs, company newsrooms, or lead generation sites. | News outlets, magazines, trade publications, editorial review sites (Wirecutter, PCMag), affiliate and comparison sites (NerdWallet, Investopedia), broadcast media, contributor-model publications (Forbes, HuffPost), personal blogs |
| PR Wire | Press release distribution services that syndicate company announcements to media outlets. | PR Newswire, Business Wire, GlobeNewswire, Accesswire, and other major PR wires |
| Institution | Government, educational, research, or public-interest nonprofit organizations. Institutional TLDs are auto-classified: .gov, .edu, .mil, .int, .gov.*, .ac.*, .nhs.*, .gouv.*, .gob. | Government sites, universities, research institutions, academic publishers (Nature, arXiv), international bodies (UN, WHO), professional associations (ABA, AMA), mission-driven nonprofits (Red Cross, UNICEF), Wikipedia |
| Social | Platforms where users publish freely and visibility is determined by votes, algorithms, or follower graphs. Does not include vendor-owned support forums or e-commerce product reviews. | Social networks (Facebook, Instagram, X/Twitter, TikTok, LinkedIn), video platforms (YouTube), discussion platforms (Reddit, Discord), Q\&A platforms (Quora, Stack Overflow), open publishing platforms (Medium, Substack), consumer review aggregators (Yelp, TripAdvisor), B2B review aggregators (G2, Capterra, TrustRadius) |
| Other | Sources that don't fit the above categories, typically where content exists to support selling products or services. Domains with fewer than 100 total citations are also classified as Other. | Corporate websites, SaaS, e-commerce, service businesses, company blogs and newsrooms, vendor-owned forums, marketplaces (Airbnb, Etsy), course platforms (Coursera, Udemy), job boards, directories, industry trade groups, lead generation sites |
| Custom | Categories you create to track specific domains or pages. | Any domains or pages you specify |
### All Citations
All Citations is a ranked table of every cited source in the selected period.
Use the search box above the table to find a domain or page, the settings icon to adjust the table, and the download icon to export it.
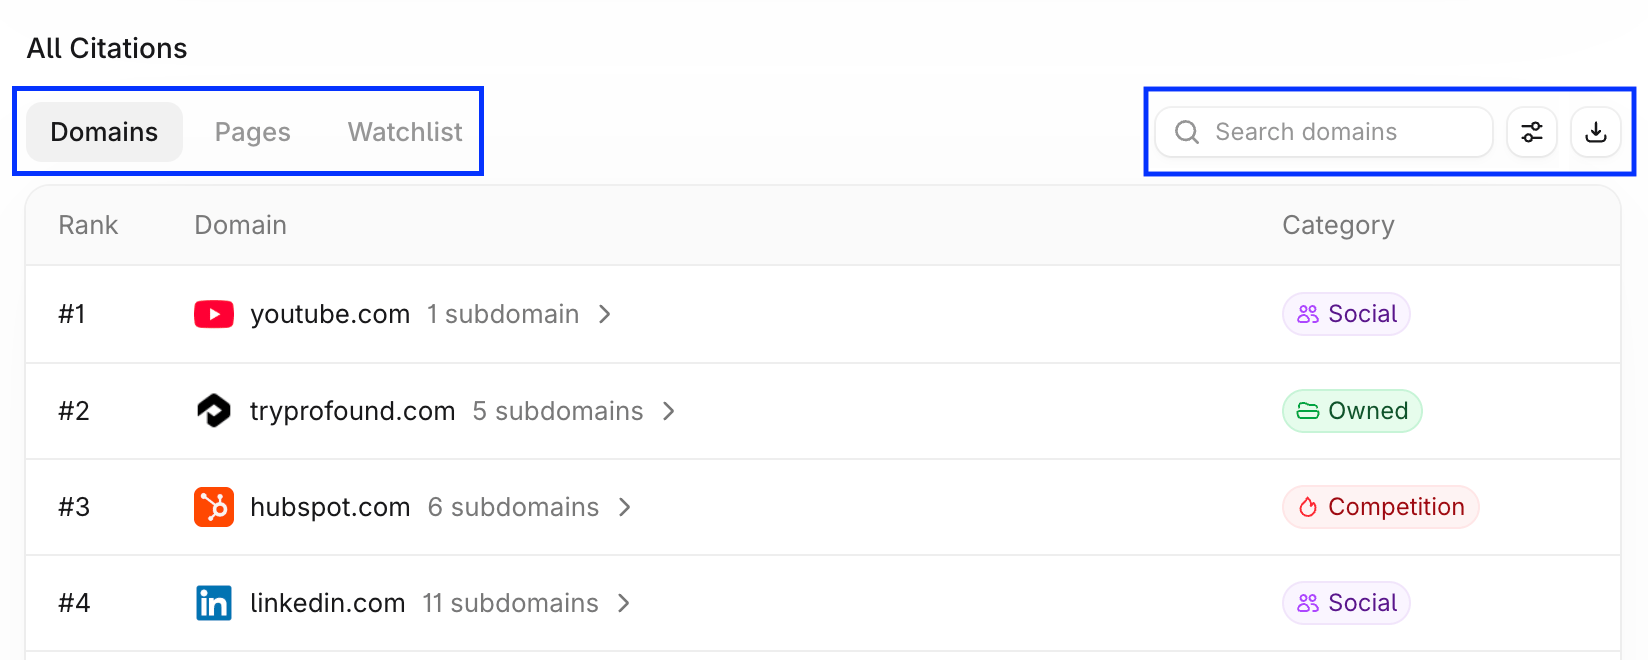 Switch between three views:
* **Domains**: the most frequently cited domains. Each row shows the domain, its category, its citation share, and any citation tags. Domains with several cited subdomains show the subdomain count.
* **Pages**: the most referenced individual URLs. Multiple pages from the same domain can appear in this list.
* **Watchlist**: specific URLs you choose to track for citation performance. While Pages lists the most cited pages overall, the Watchlist lets you define and monitor a custom set of URLs.
### Citation Decay
Citation Decay shows how long sources keep getting cited after they first appear. Switch between **Domains** and **Pages**. The summary at the top shows the **Average Rise** (days from first citation to peak citation count) and **Average Half-life** (days for citations to fall to half of their peak and stay there) across all sources.
Switch between three views:
* **Domains**: the most frequently cited domains. Each row shows the domain, its category, its citation share, and any citation tags. Domains with several cited subdomains show the subdomain count.
* **Pages**: the most referenced individual URLs. Multiple pages from the same domain can appear in this list.
* **Watchlist**: specific URLs you choose to track for citation performance. While Pages lists the most cited pages overall, the Watchlist lets you define and monitor a custom set of URLs.
### Citation Decay
Citation Decay shows how long sources keep getting cited after they first appear. Switch between **Domains** and **Pages**. The summary at the top shows the **Average Rise** (days from first citation to peak citation count) and **Average Half-life** (days for citations to fall to half of their peak and stay there) across all sources.
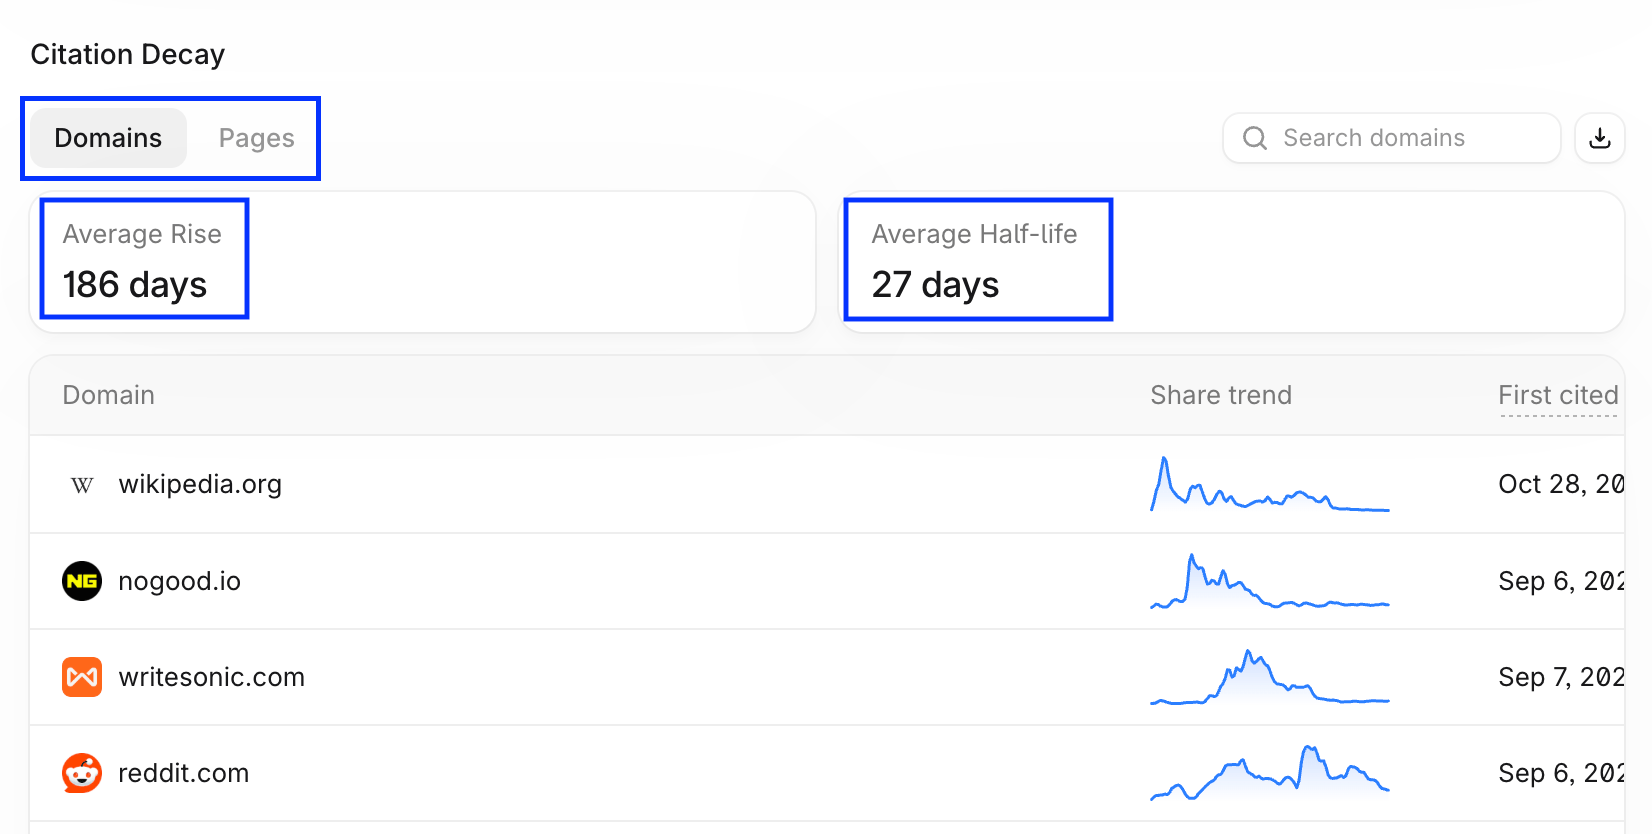 Each row shows the share trend, the date the source was first cited, its rise in days, peak share, peak date, half-life in days, and the date it was last cited. Use this table to spot content that is losing traction and content that answer engines have recently picked up.
### Citation Ranking
Citation Ranking is a customizable heat map of citation share across two dimensions, for example how much each domain is cited within each topic. Configure it with the **Value**, **Rows**, and **Columns** controls, the same way as Visibility Ranking.
Each row shows the share trend, the date the source was first cited, its rise in days, peak share, peak date, half-life in days, and the date it was last cited. Use this table to spot content that is losing traction and content that answer engines have recently picked up.
### Citation Ranking
Citation Ranking is a customizable heat map of citation share across two dimensions, for example how much each domain is cited within each topic. Configure it with the **Value**, **Rows**, and **Columns** controls, the same way as Visibility Ranking.
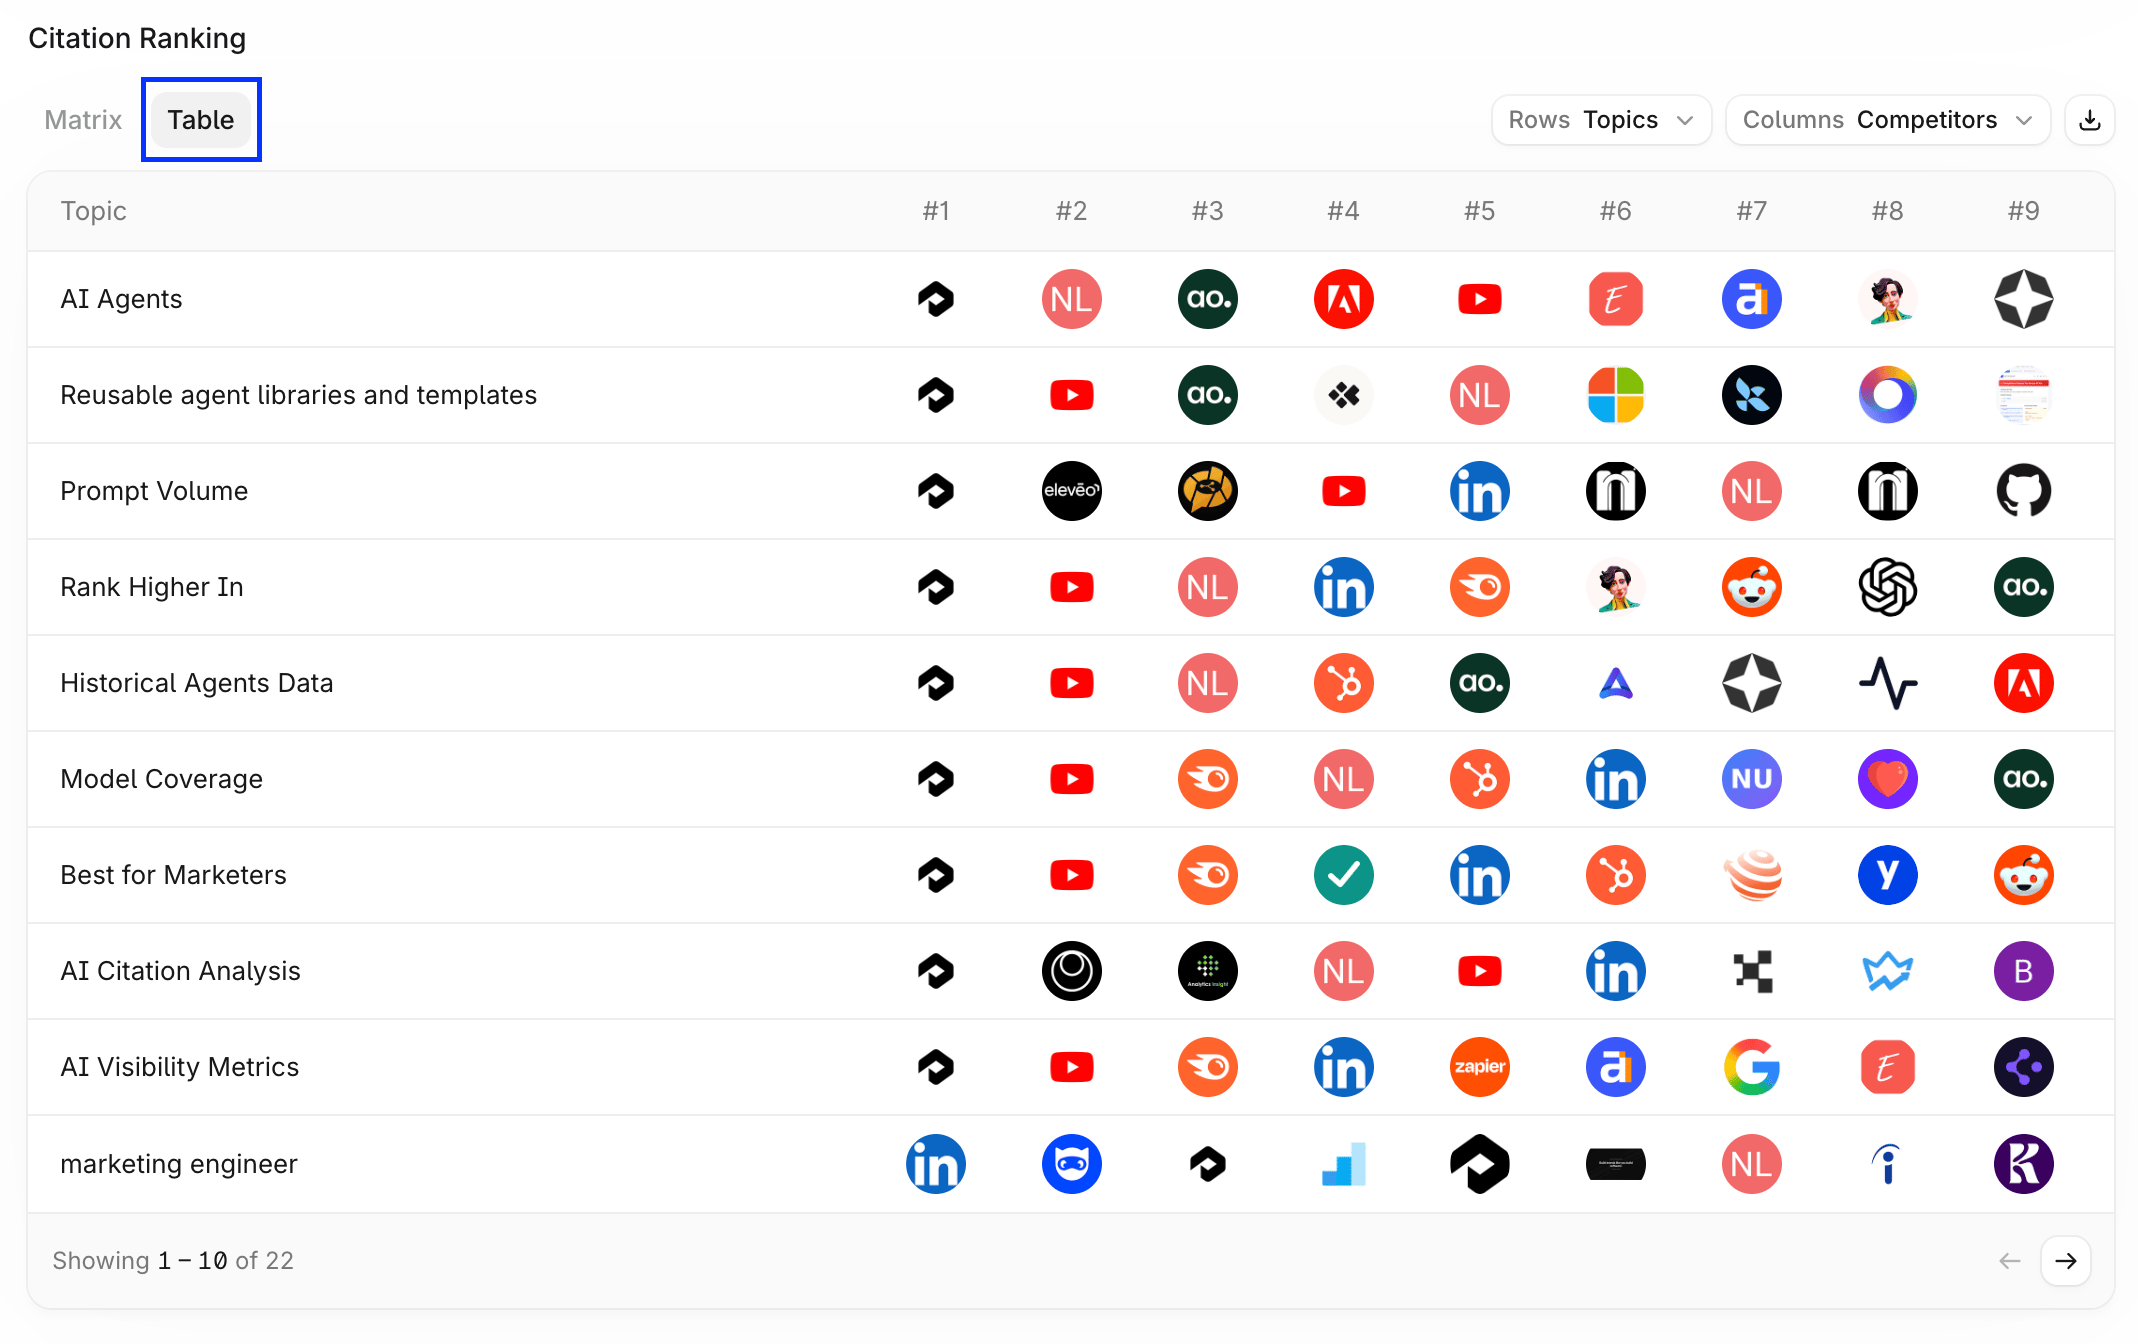
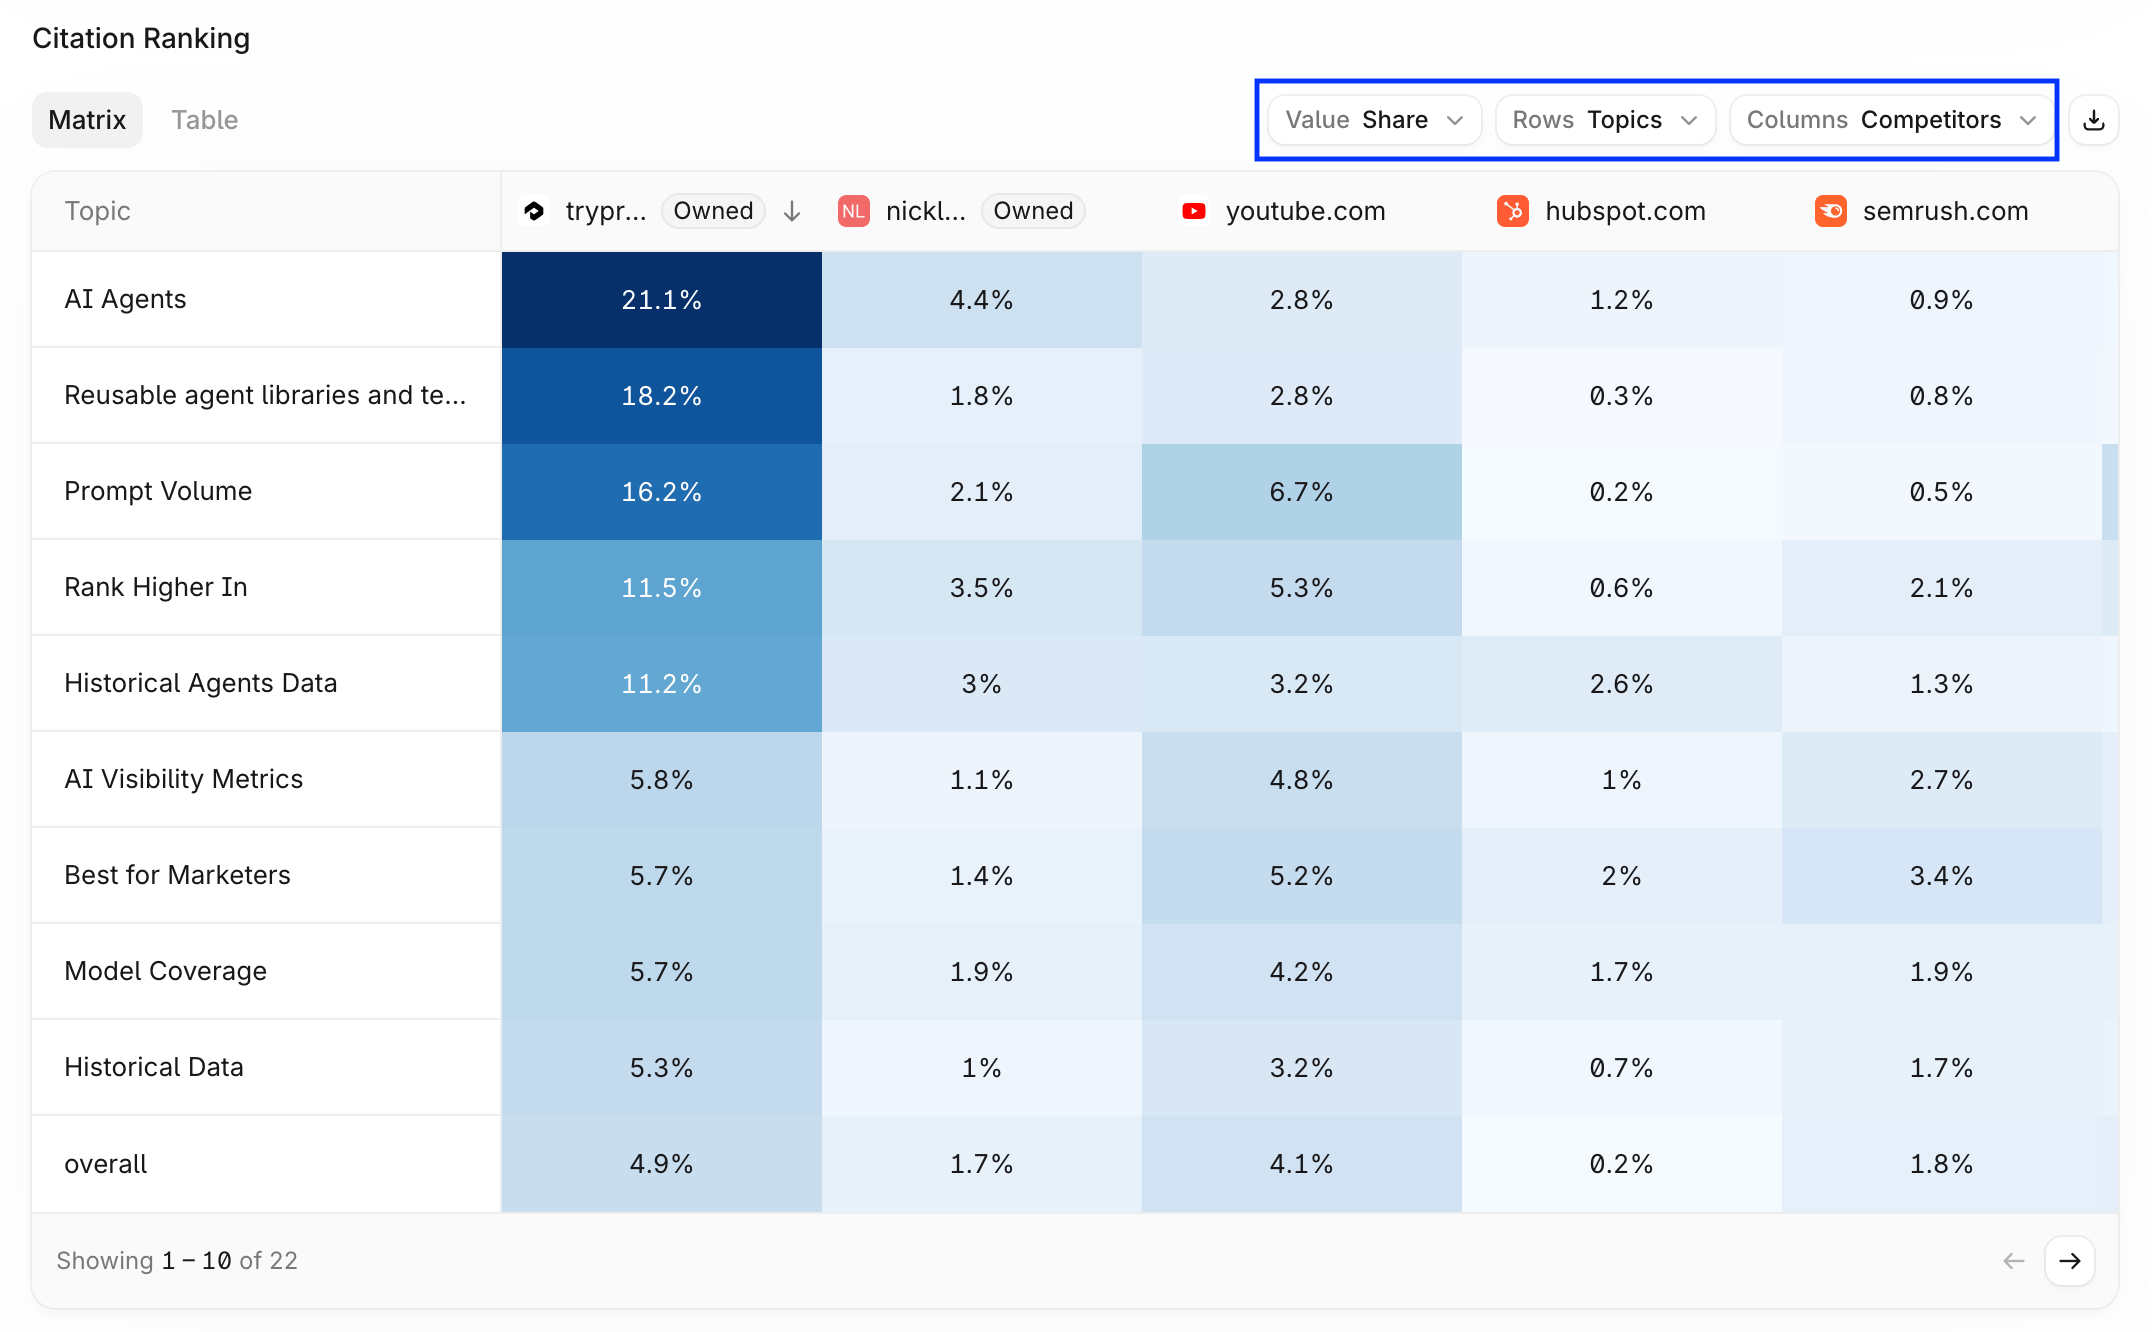 Select **Table** to switch to a standard rank table.
 ### Citation Relationships
The Citation Relationships chart visualizes how citations are connected across answer engines and topics. Select **3D** or **2D**, then select **Show Graph** to render it.
### Citation Relationships
The Citation Relationships chart visualizes how citations are connected across answer engines and topics. Select **3D** or **2D**, then select **Show Graph** to render it.
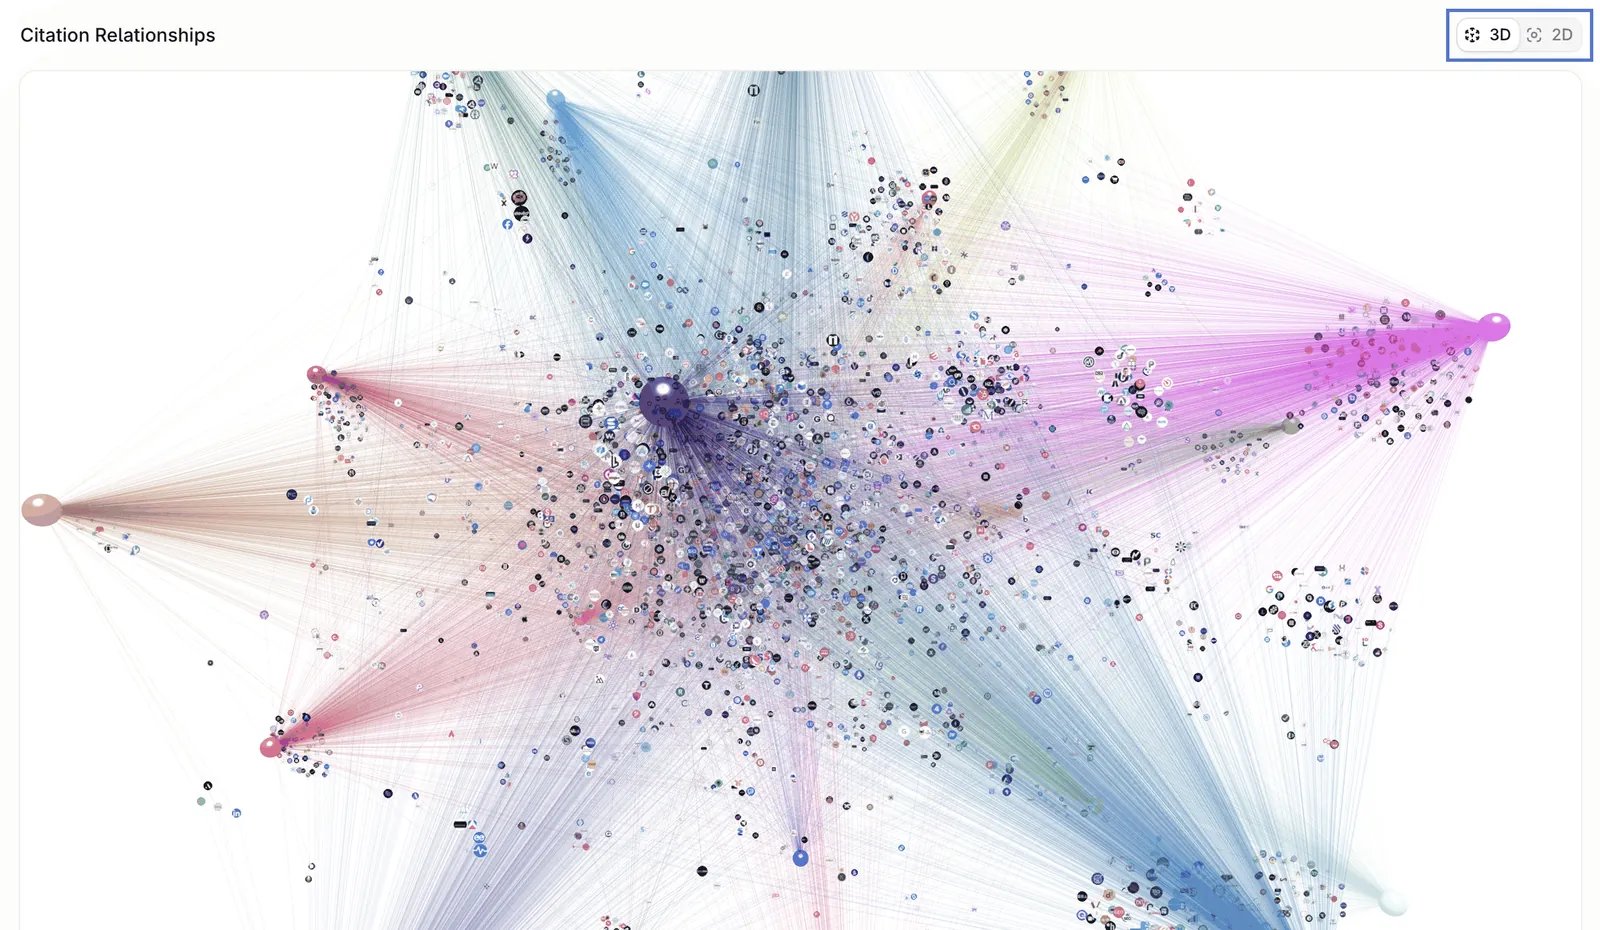 Clusters represent groups of cited sources that share mentions for a particular topic and platform. For example, if your brand is mentioned in two different publications that are both cited by AI answer engine platforms, those publications appear in the same cluster.
## Prompts
The **Prompts** tab shows performance for every prompt you track, and the queries answer engines generate from them.
Clusters represent groups of cited sources that share mentions for a particular topic and platform. For example, if your brand is mentioned in two different publications that are both cited by AI answer engine platforms, those publications appear in the same cluster.
## Prompts
The **Prompts** tab shows performance for every prompt you track, and the queries answer engines generate from them.
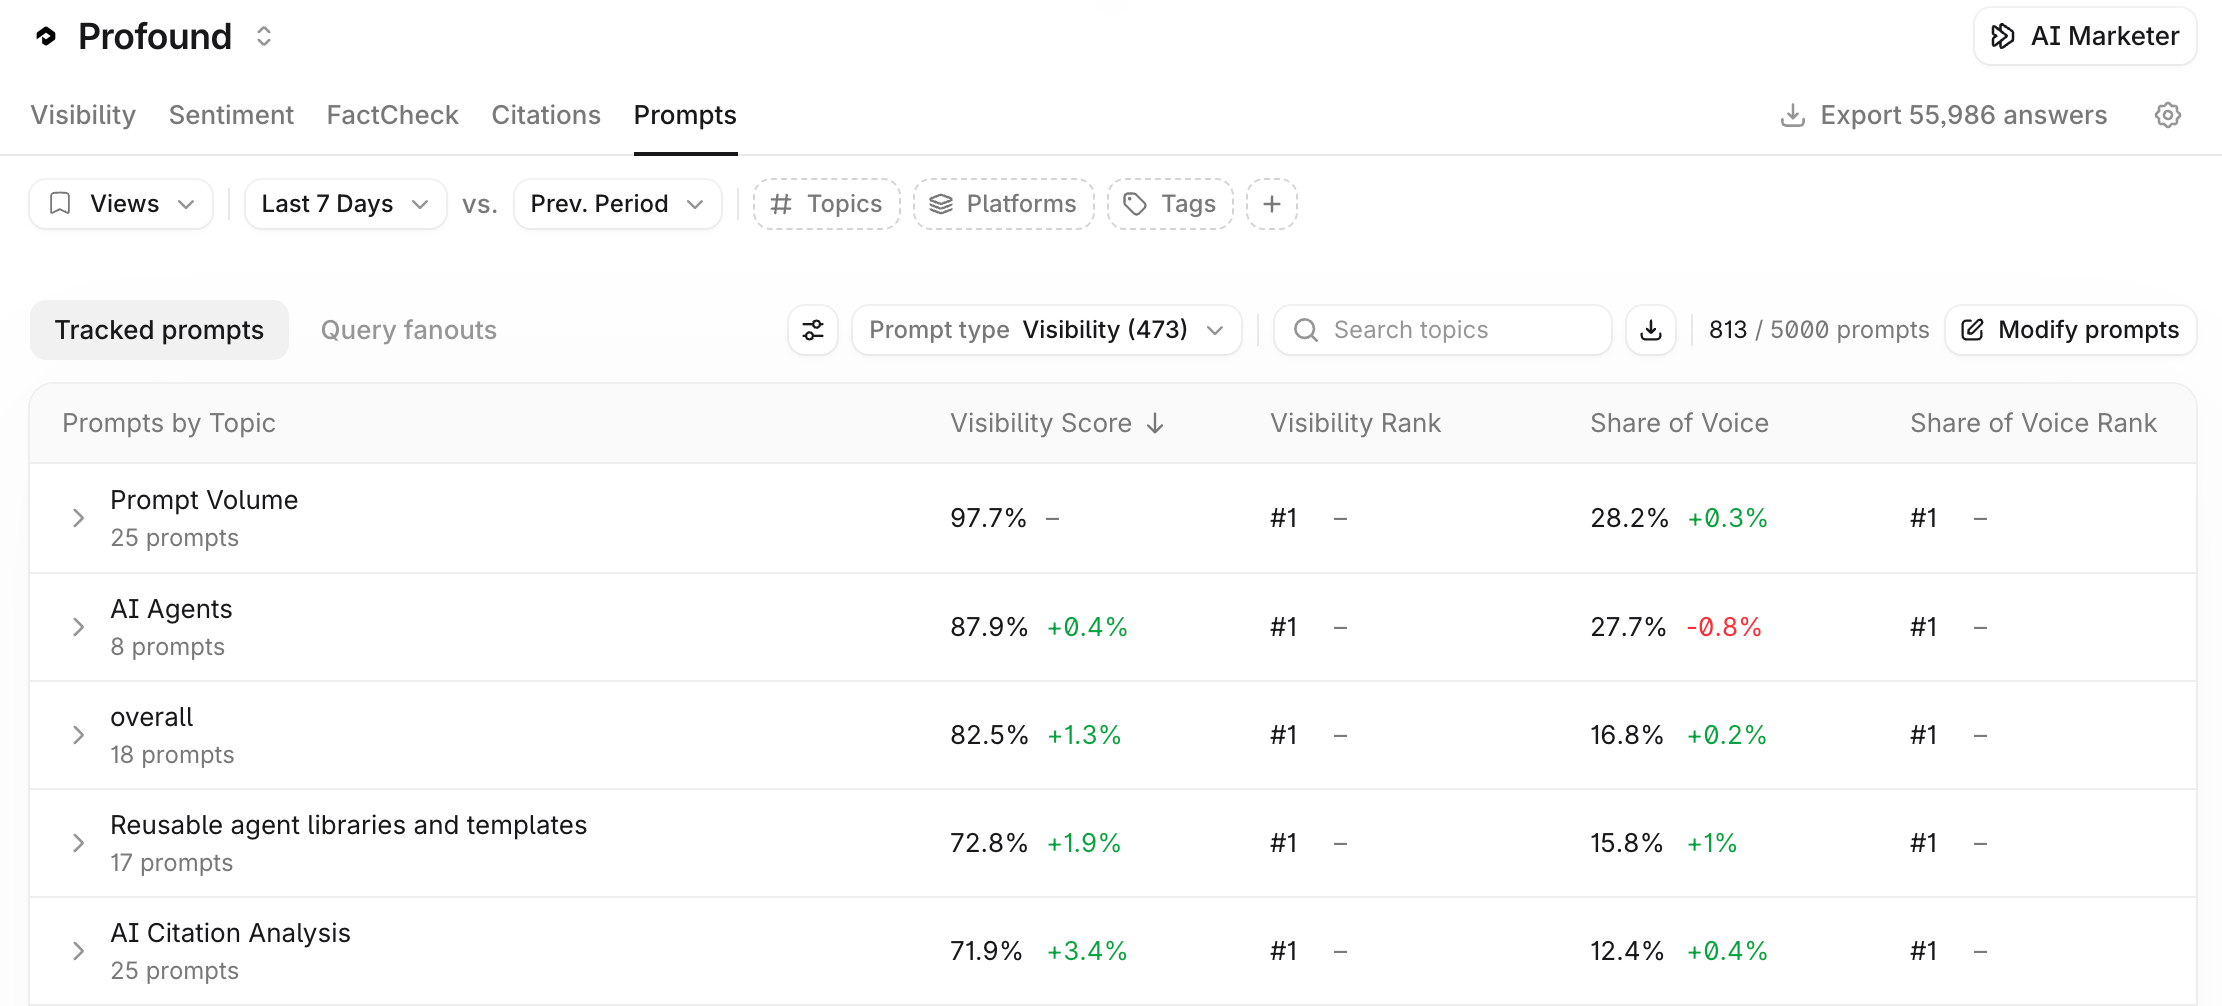 ### Tracked prompts
The **Tracked prompts** table groups prompts by topic. Expand a topic to see the prompts within it. Each row shows Visibility Score, Visibility Rank, Share of Voice, Share of Voice Rank, Average Position, Citation Share, Citation Rank, Executions, and Prompt Volume, each with its change versus the comparison period. Sort the table by a metric's current value or by its change versus the comparison period.
Controls above the table:
* **Prompt type**: filter to prompts with a given analysis type, such as Visibility, Sentiment, or FactCheck.
* **Search topics**: find a topic or prompt by name.
* **Download icon**: export the table.
* **Modify prompts**: open the Prompt Designer to add, edit, or tag prompts.
* **Settings icon**: change **Group by** (for example, topic) and **Customize columns**.
Learn more about managing prompts in [Create, manage and tag prompts](/answer-engine-insights/prompt-designer).
### Query fanouts
Answer engines often turn a single prompt into several search queries before they answer. The **Query fanouts** view shows those queries for each prompt you track.
Each row is a prompt, with its **Query Count** (the number of distinct queries generated in the period) and **Average Queries Per Execution**. Expand a prompt to see the individual queries. Select **View all** to view all queries for a prompt.
### Tracked prompts
The **Tracked prompts** table groups prompts by topic. Expand a topic to see the prompts within it. Each row shows Visibility Score, Visibility Rank, Share of Voice, Share of Voice Rank, Average Position, Citation Share, Citation Rank, Executions, and Prompt Volume, each with its change versus the comparison period. Sort the table by a metric's current value or by its change versus the comparison period.
Controls above the table:
* **Prompt type**: filter to prompts with a given analysis type, such as Visibility, Sentiment, or FactCheck.
* **Search topics**: find a topic or prompt by name.
* **Download icon**: export the table.
* **Modify prompts**: open the Prompt Designer to add, edit, or tag prompts.
* **Settings icon**: change **Group by** (for example, topic) and **Customize columns**.
Learn more about managing prompts in [Create, manage and tag prompts](/answer-engine-insights/prompt-designer).
### Query fanouts
Answer engines often turn a single prompt into several search queries before they answer. The **Query fanouts** view shows those queries for each prompt you track.
Each row is a prompt, with its **Query Count** (the number of distinct queries generated in the period) and **Average Queries Per Execution**. Expand a prompt to see the individual queries. Select **View all** to view all queries for a prompt.
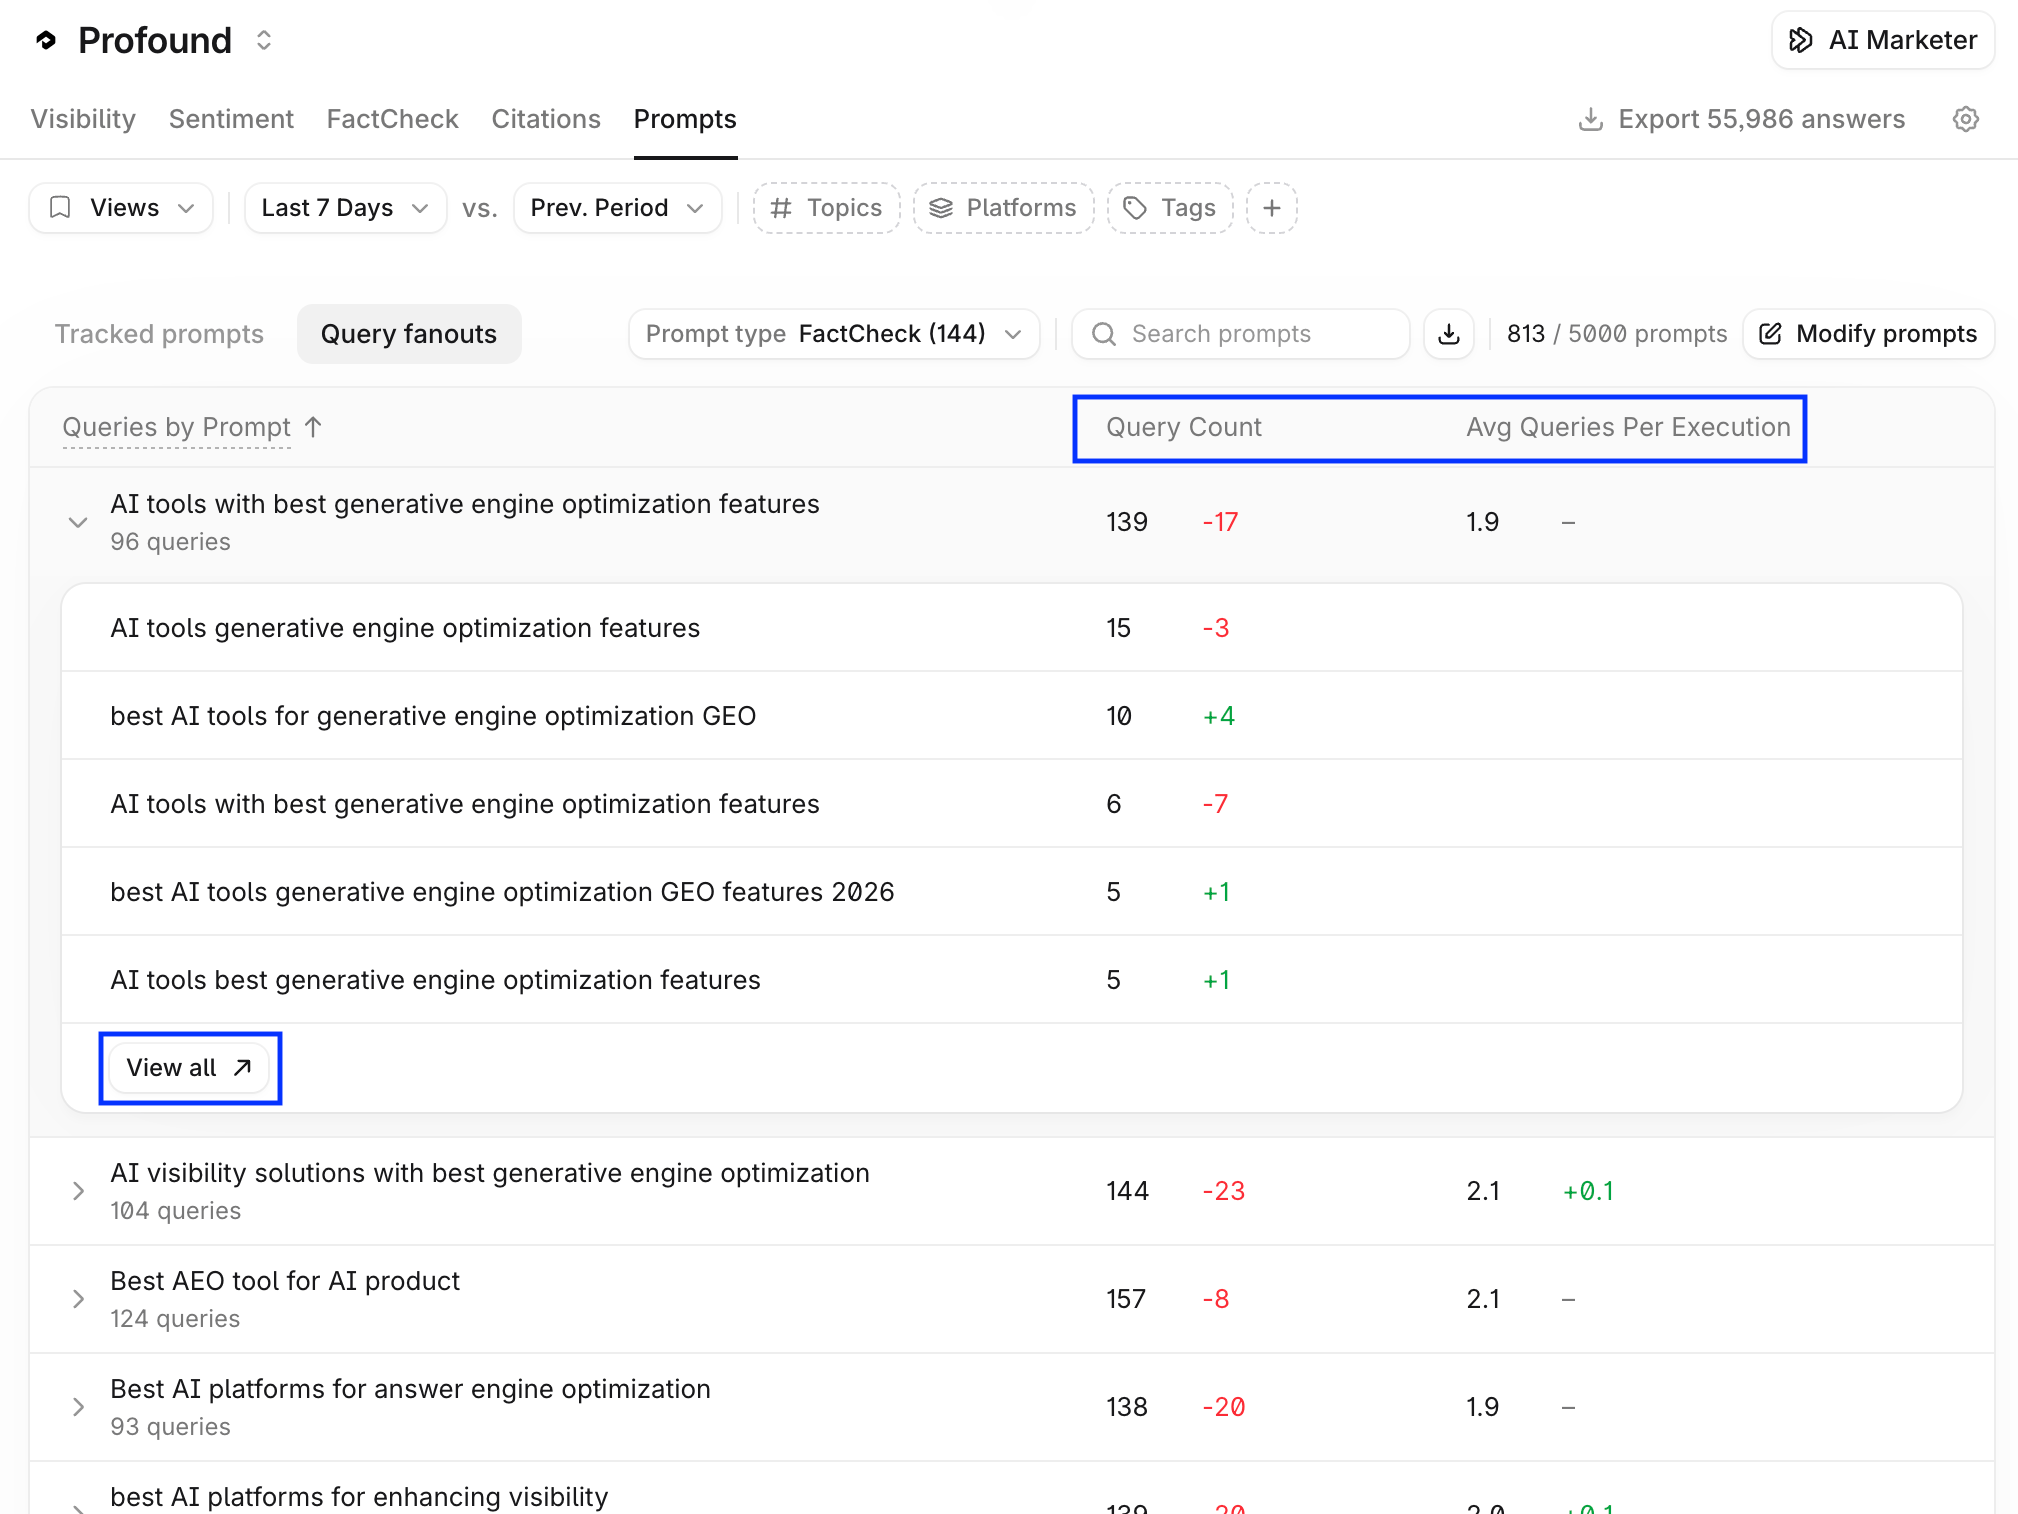 Use this view to understand how answer engines interpret your prompts and which underlying searches your content needs to rank for.
To see the more detailed analysis of a prompt, hover over it and select **Analyze**.
Use this view to understand how answer engines interpret your prompts and which underlying searches your content needs to rank for.
To see the more detailed analysis of a prompt, hover over it and select **Analyze**.
 This opens the **Query Fanout Analysis** view for the prompt. Select Show Prompt Diffs to compare how queries changed across executions.
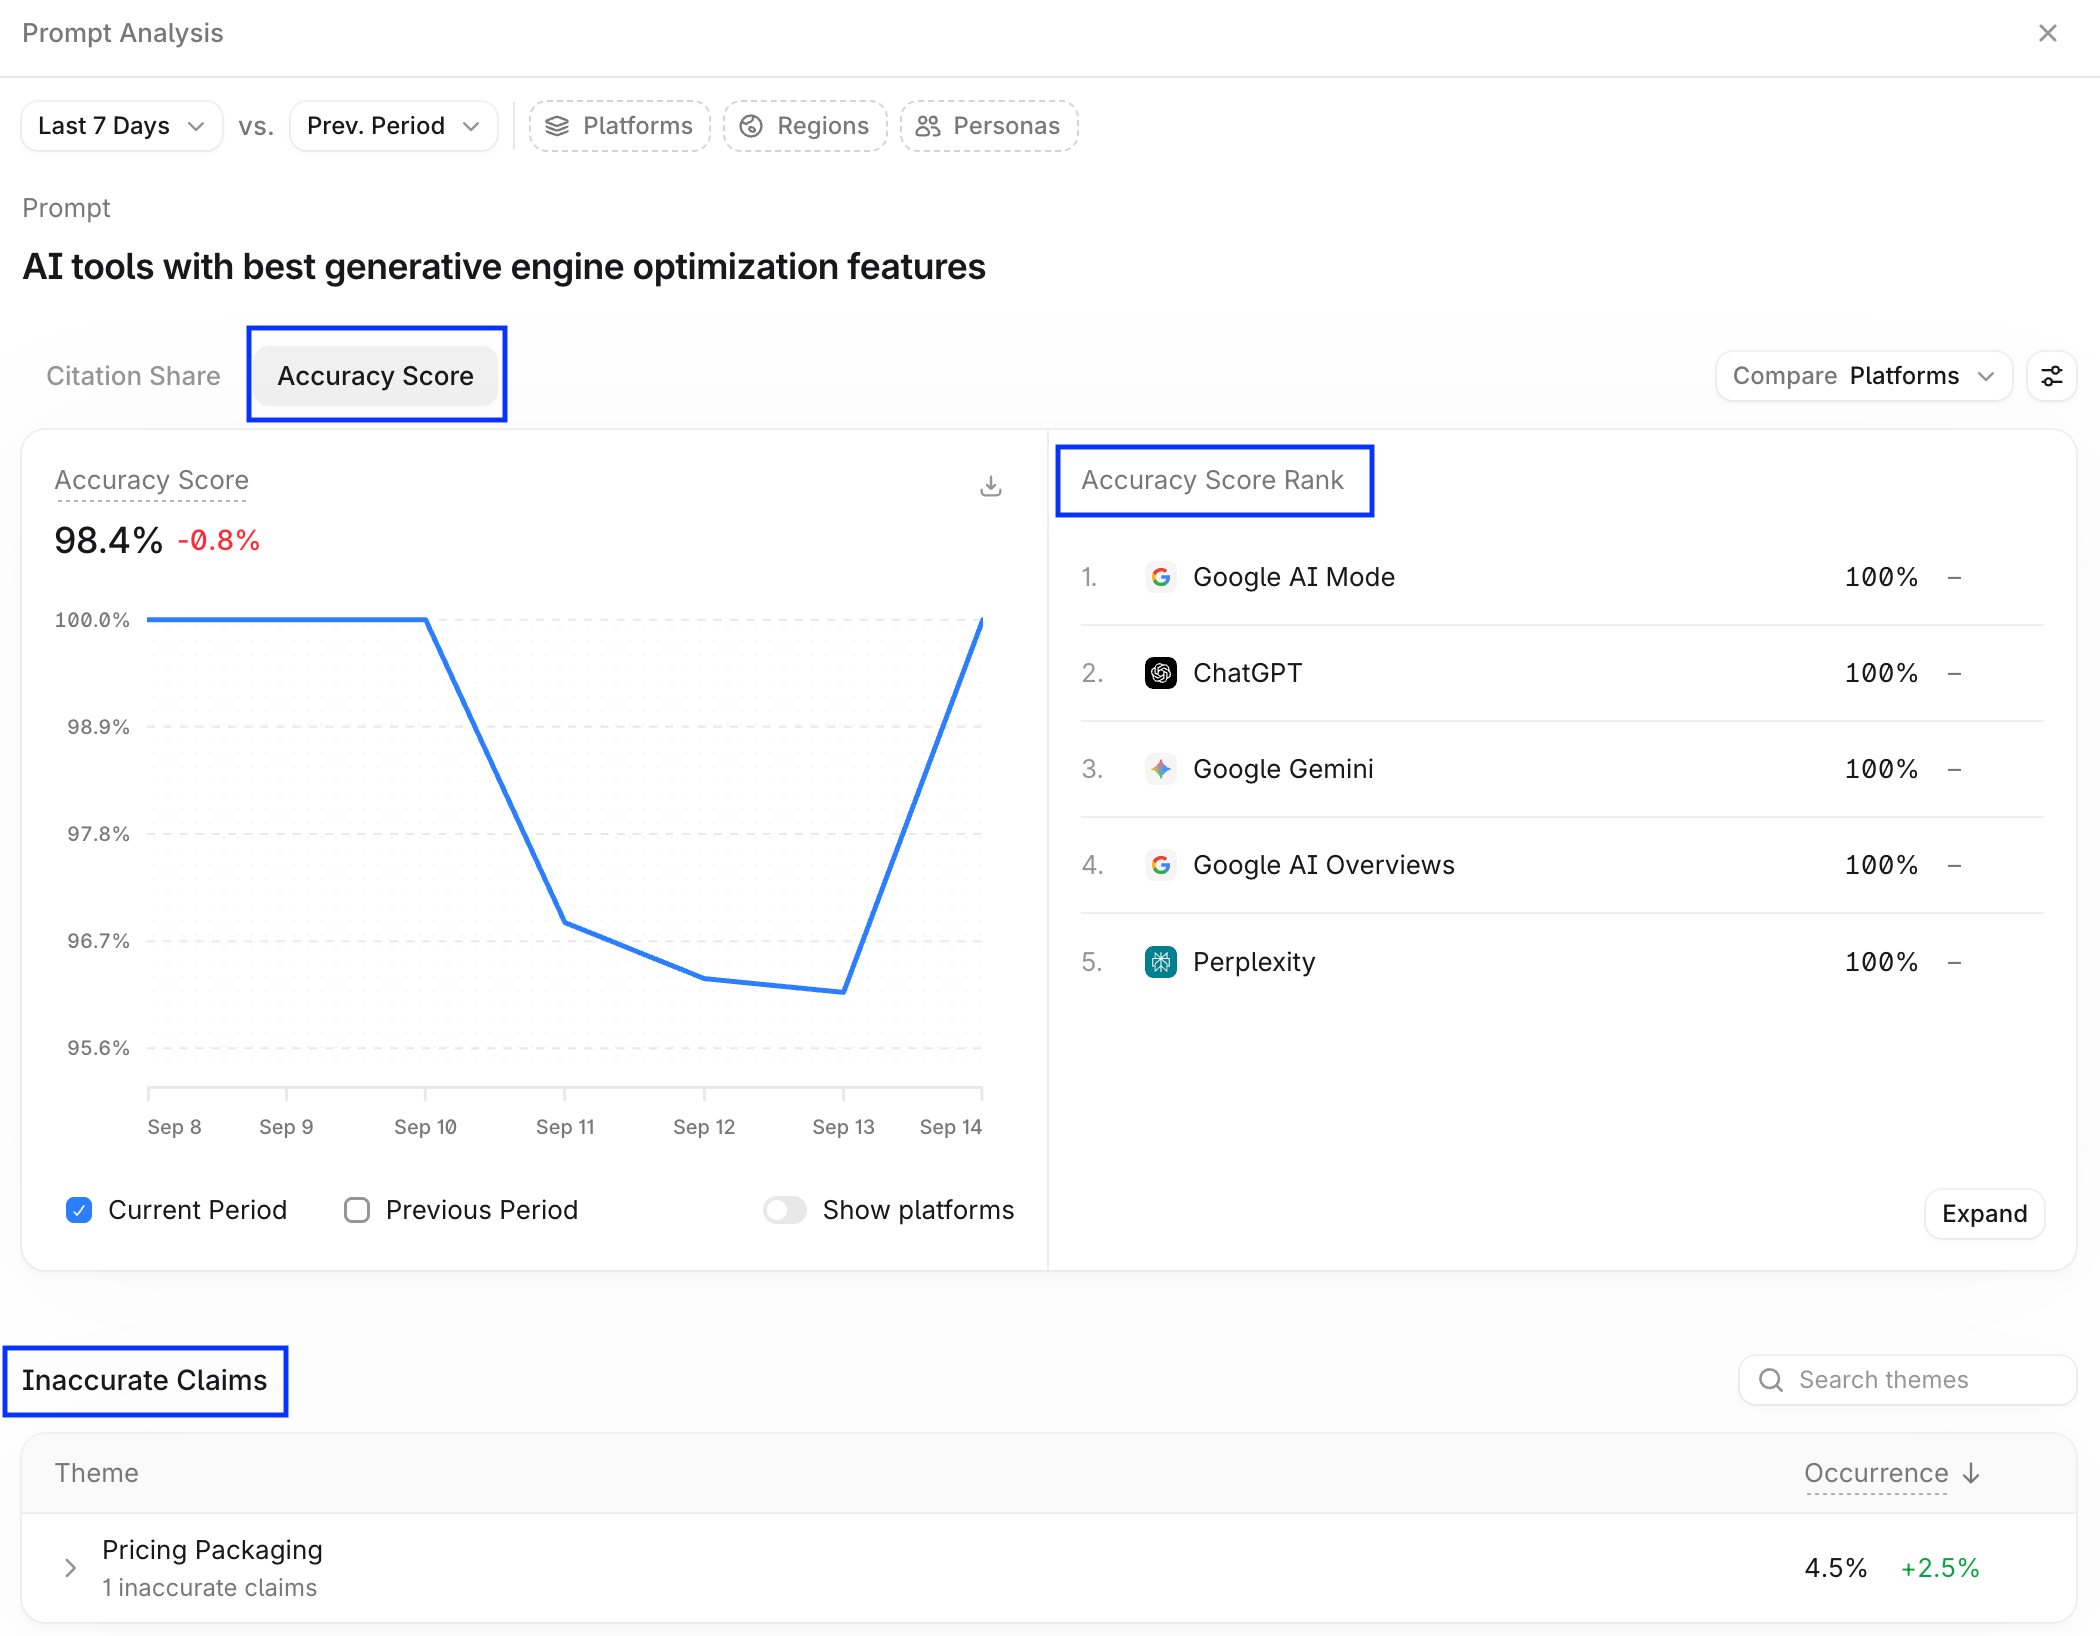
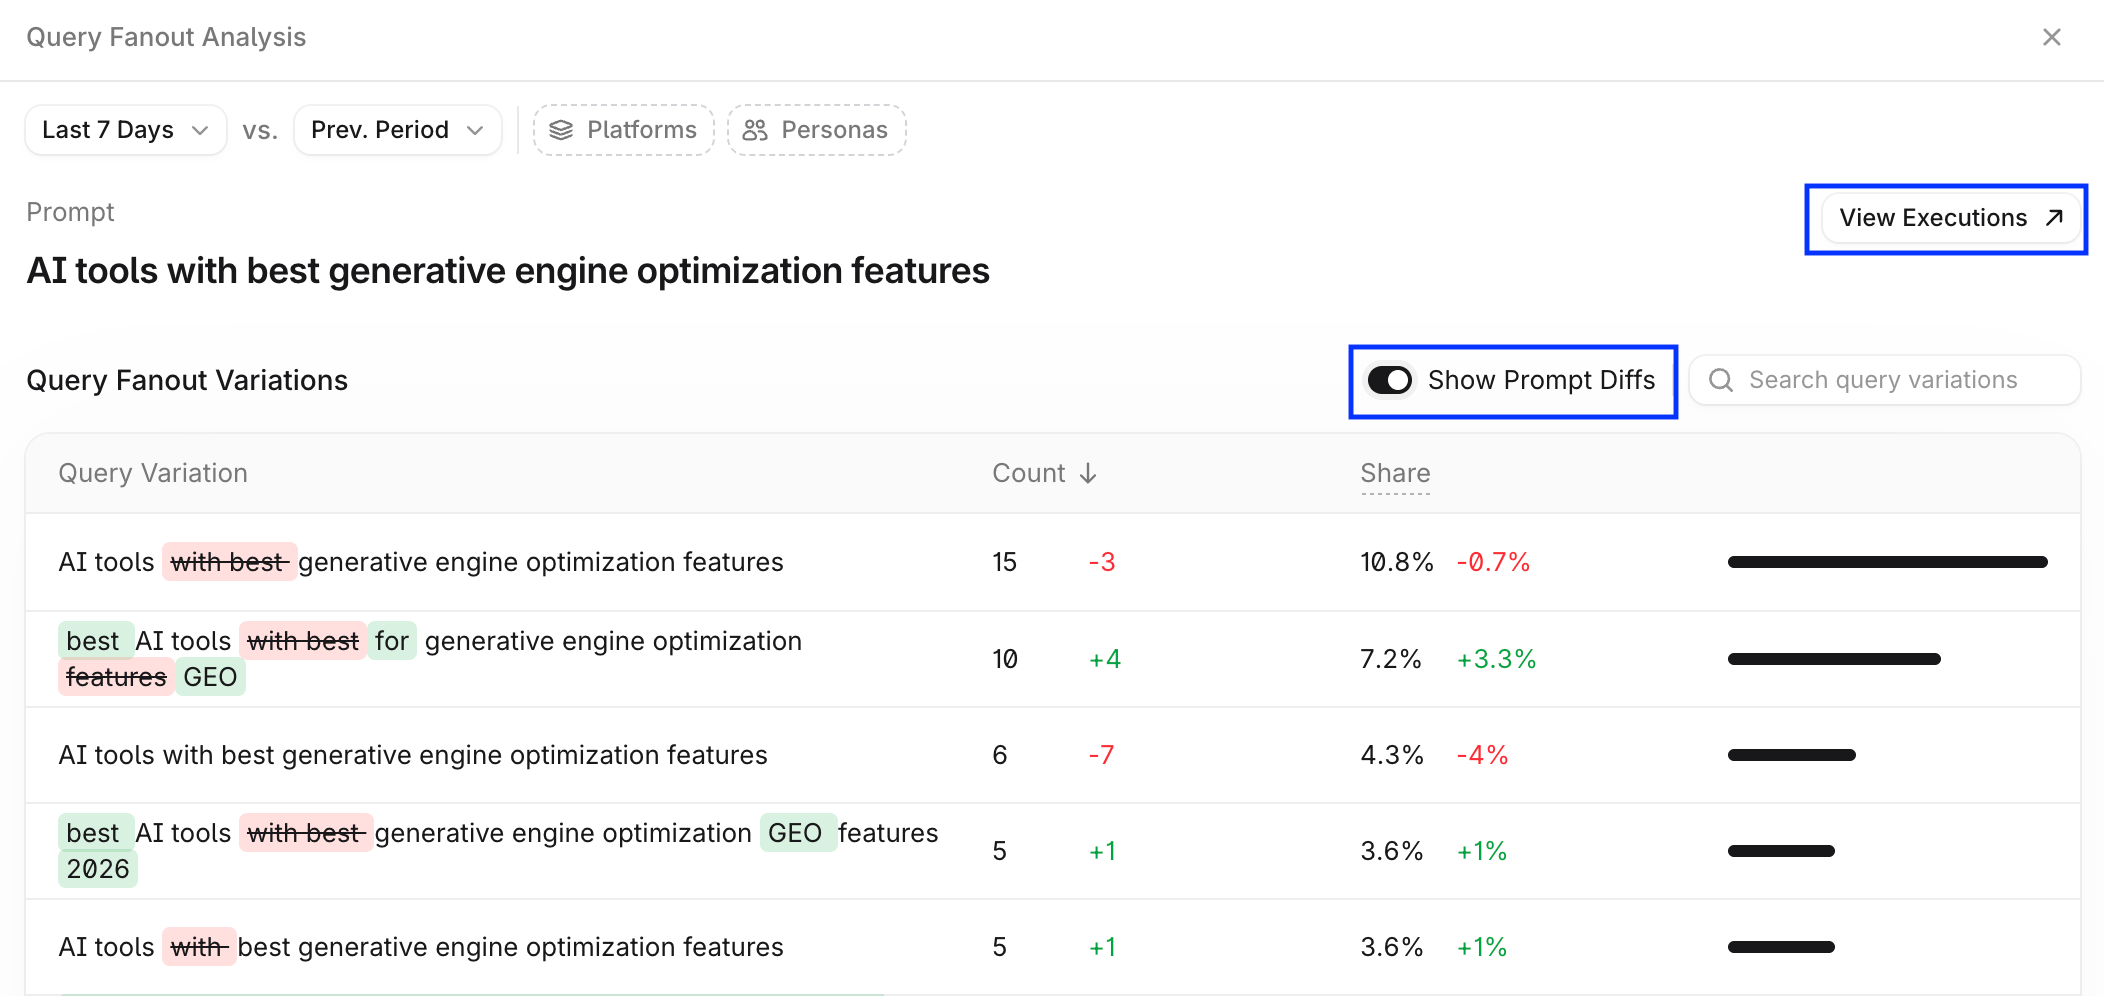 Select **View Executions** for a more detailed prompt executions analysis. The metrics you see depend on your prompt type. For example, for a FactCheck prompt, it's the accuracy-related views and claim analysis, and for a Visibility prompt it's Visibility Score and visibility and citations breakdown.
 ## Sentiment
The **Sentiment** tab tracks how answer engines describe your brand. Learn more in [About Sentiment](/answer-engine-insights/sentiment/about) and the [Getting started with Sentiment](/answer-engine-insights/sentiment/getting-started) guide.
## FactCheck
The **FactCheck** tab tracks the accuracy of what answer engines say about your brand. Learn more in [About FactCheck](/answer-engine-insights/factcheck/about) and the [Getting started with FactCheck](/answer-engine-insights/factcheck/getting-started) guide.
## Investigate charts with AI Marketer
To ask [AI Marketer](/aim/about) to interpret a chart, select a point or a date range on it, then select **Investigate**:
* To investigate a single date, click a point on a line chart to pin that date.
* To investigate a period, click and drag across points on a line chart to select a date range.
## Sentiment
The **Sentiment** tab tracks how answer engines describe your brand. Learn more in [About Sentiment](/answer-engine-insights/sentiment/about) and the [Getting started with Sentiment](/answer-engine-insights/sentiment/getting-started) guide.
## FactCheck
The **FactCheck** tab tracks the accuracy of what answer engines say about your brand. Learn more in [About FactCheck](/answer-engine-insights/factcheck/about) and the [Getting started with FactCheck](/answer-engine-insights/factcheck/getting-started) guide.
## Investigate charts with AI Marketer
To ask [AI Marketer](/aim/about) to interpret a chart, select a point or a date range on it, then select **Investigate**:
* To investigate a single date, click a point on a line chart to pin that date.
* To investigate a period, click and drag across points on a line chart to select a date range.
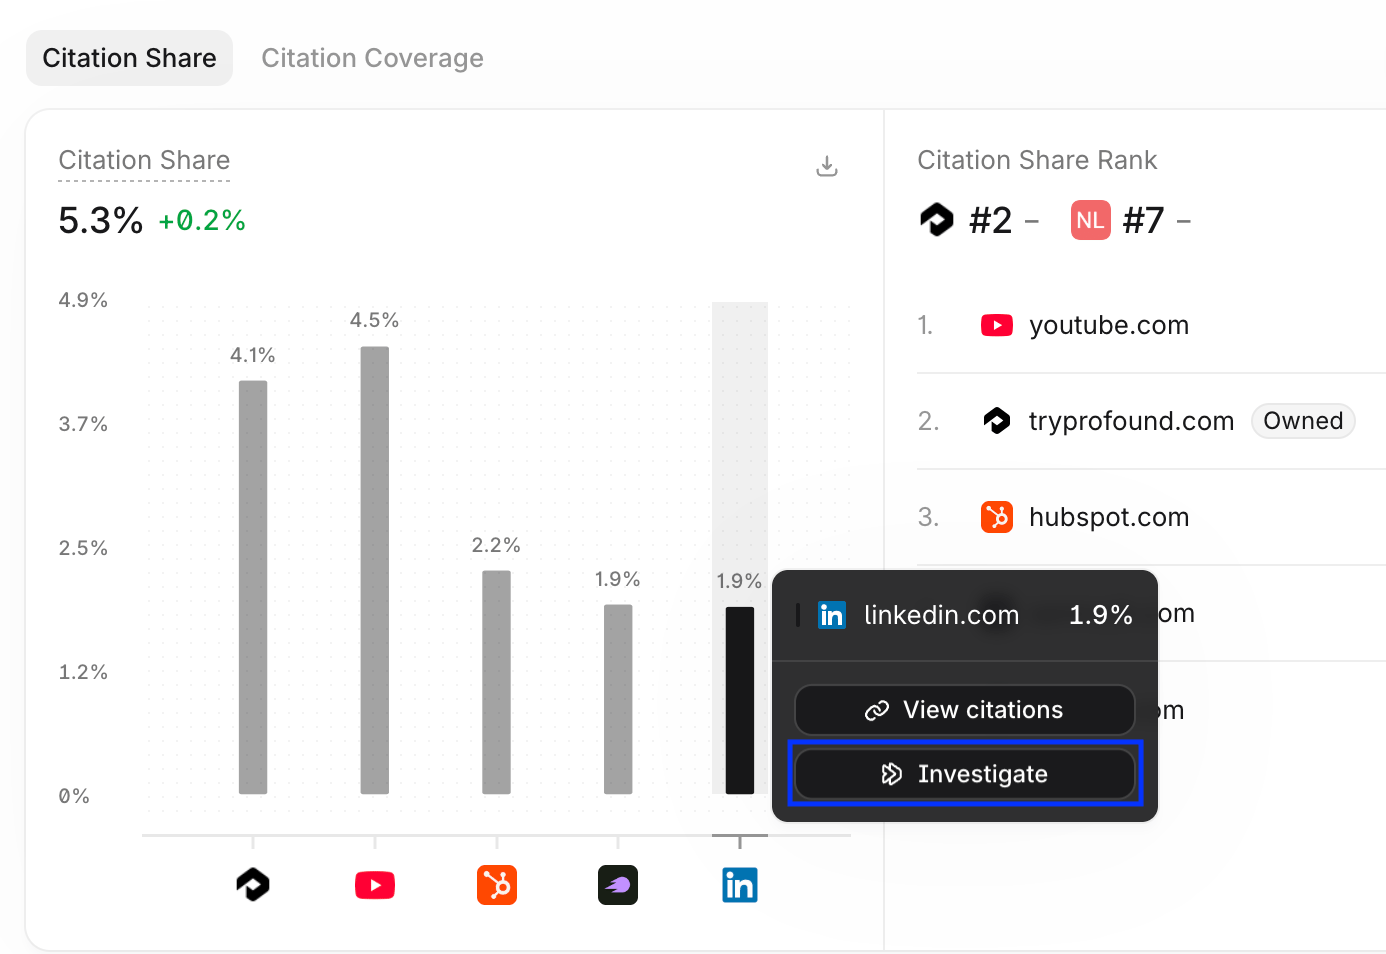 Profound opens AI Marketer in the side panel and sends a prompt that includes the chart and the date or date range you selected, so you can ask what drove the change. Investigate is available in most charts, including the Visibility, Sentiment, FactCheck, Citations, and Query fanouts charts.
Learn how to prompt AI Marketer in [Writing prompts for AI Marketer (Aim): best practices and examples](/aim/writing-prompts).
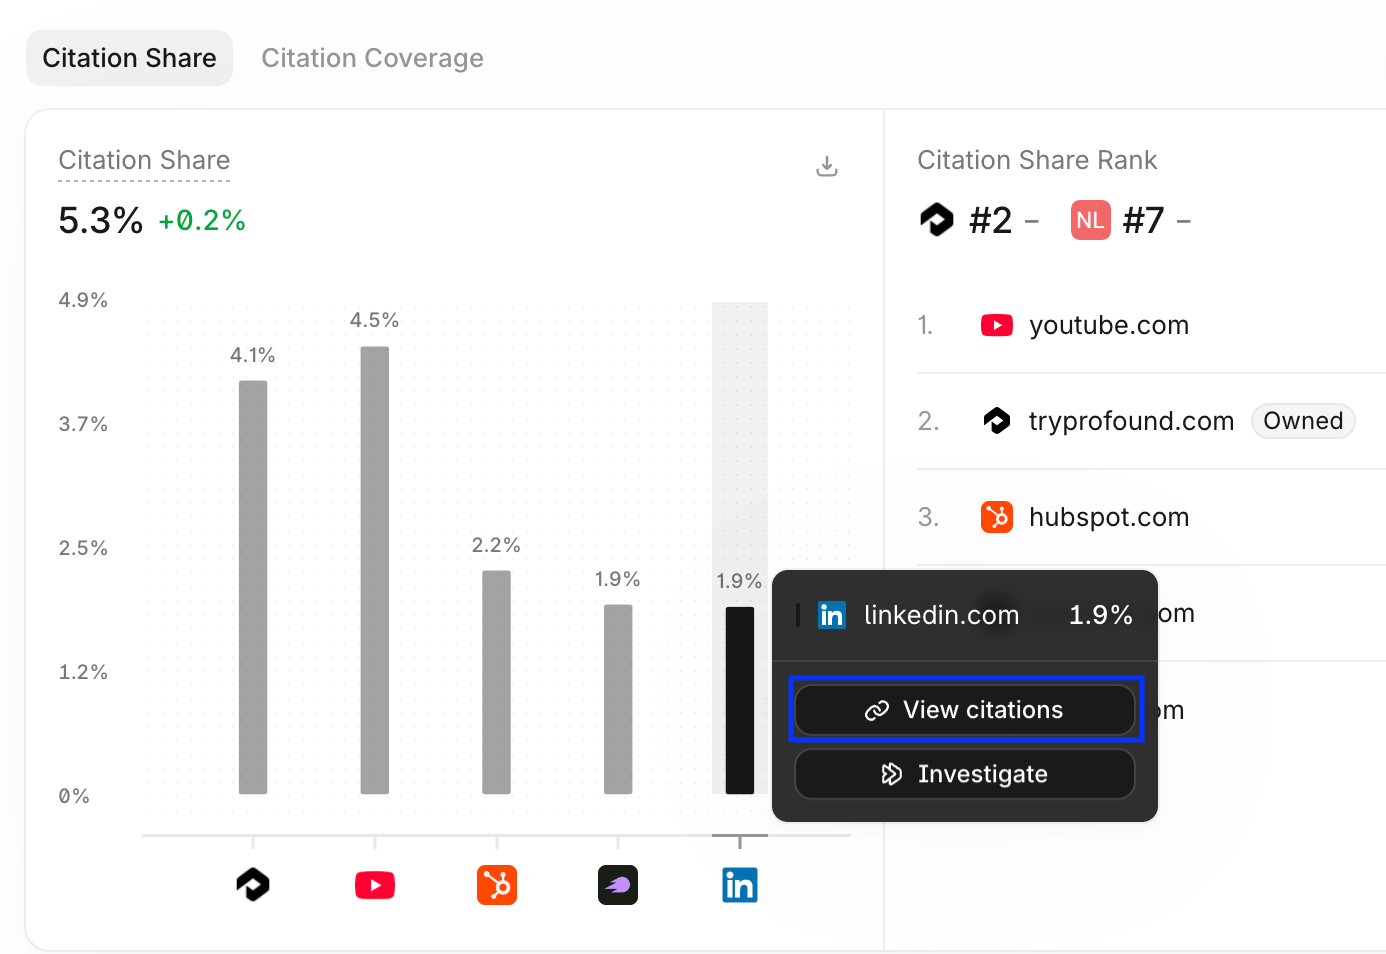
Select **View citations** (or **View executions** in Visibility tab) to view the underlying data for that point in the chart.
Profound opens AI Marketer in the side panel and sends a prompt that includes the chart and the date or date range you selected, so you can ask what drove the change. Investigate is available in most charts, including the Visibility, Sentiment, FactCheck, Citations, and Query fanouts charts.
Learn how to prompt AI Marketer in [Writing prompts for AI Marketer (Aim): best practices and examples](/aim/writing-prompts).
Select **View citations** (or **View executions** in Visibility tab) to view the underlying data for that point in the chart.
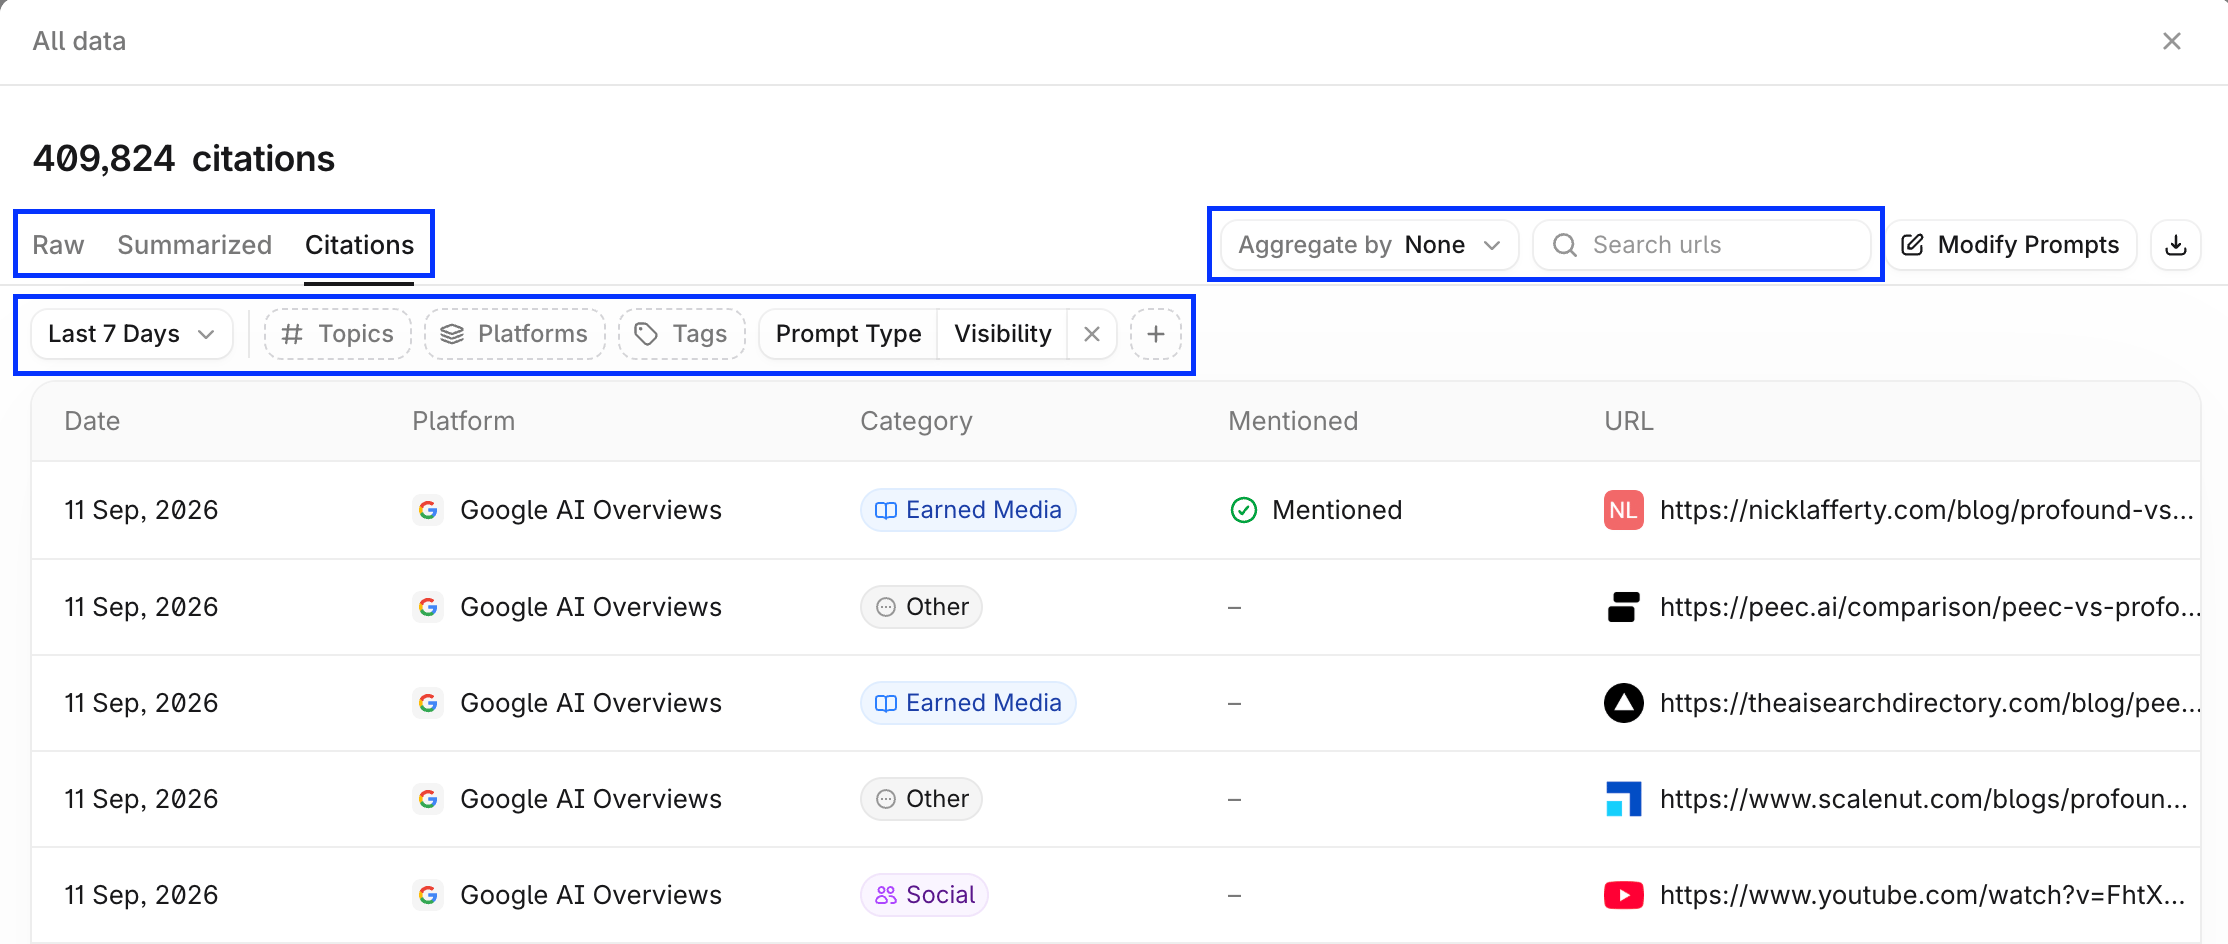
 Filter and group the data in the **All data** view using the options above the table.
 ## Annotate charts
Chart annotations are notes pinned to dates on time-series line charts. They show what happened, such as a launch, a model change on an AI platform, or a prompt update, next to the trend it may have affected. Learn more in [Chart annotations in AEI](/answer-engine-insights/chart-annotations).
## Annotate charts
Chart annotations are notes pinned to dates on time-series line charts. They show what happened, such as a launch, a model change on an AI platform, or a prompt update, next to the trend it may have affected. Learn more in [Chart annotations in AEI](/answer-engine-insights/chart-annotations).