> ## Documentation Index
> Fetch the complete documentation index at: https://docs.tryprofound.com/llms.txt
> Use this file to discover all available pages before exploring further.
# AEI のチャート注釈
> Answer Engine Insights のチャートにイベントを記録して、メトリクスの経時的な変化を説明します
**利用可能なプラン:** Enterprise プラン
**場所:** Analytics > Answer Engine Insights
**必要なロール:** すべてのロールが閲覧でき、Admin と Editor が作成・管理できます。プロンプトの更新を行ったユーザーを確認するには、View Activity Logs 権限が必要です。
チャート注釈 (Chart Annotations) は、チャート上の日付に固定されるメモです。製品のリリース、コンテンツの更新、プロンプトの変更などのイベントを記録するために使用すると、トレンドを確認するすべてのユーザーがその背景にあるコンテキストを把握できます。
## 注釈を表示する
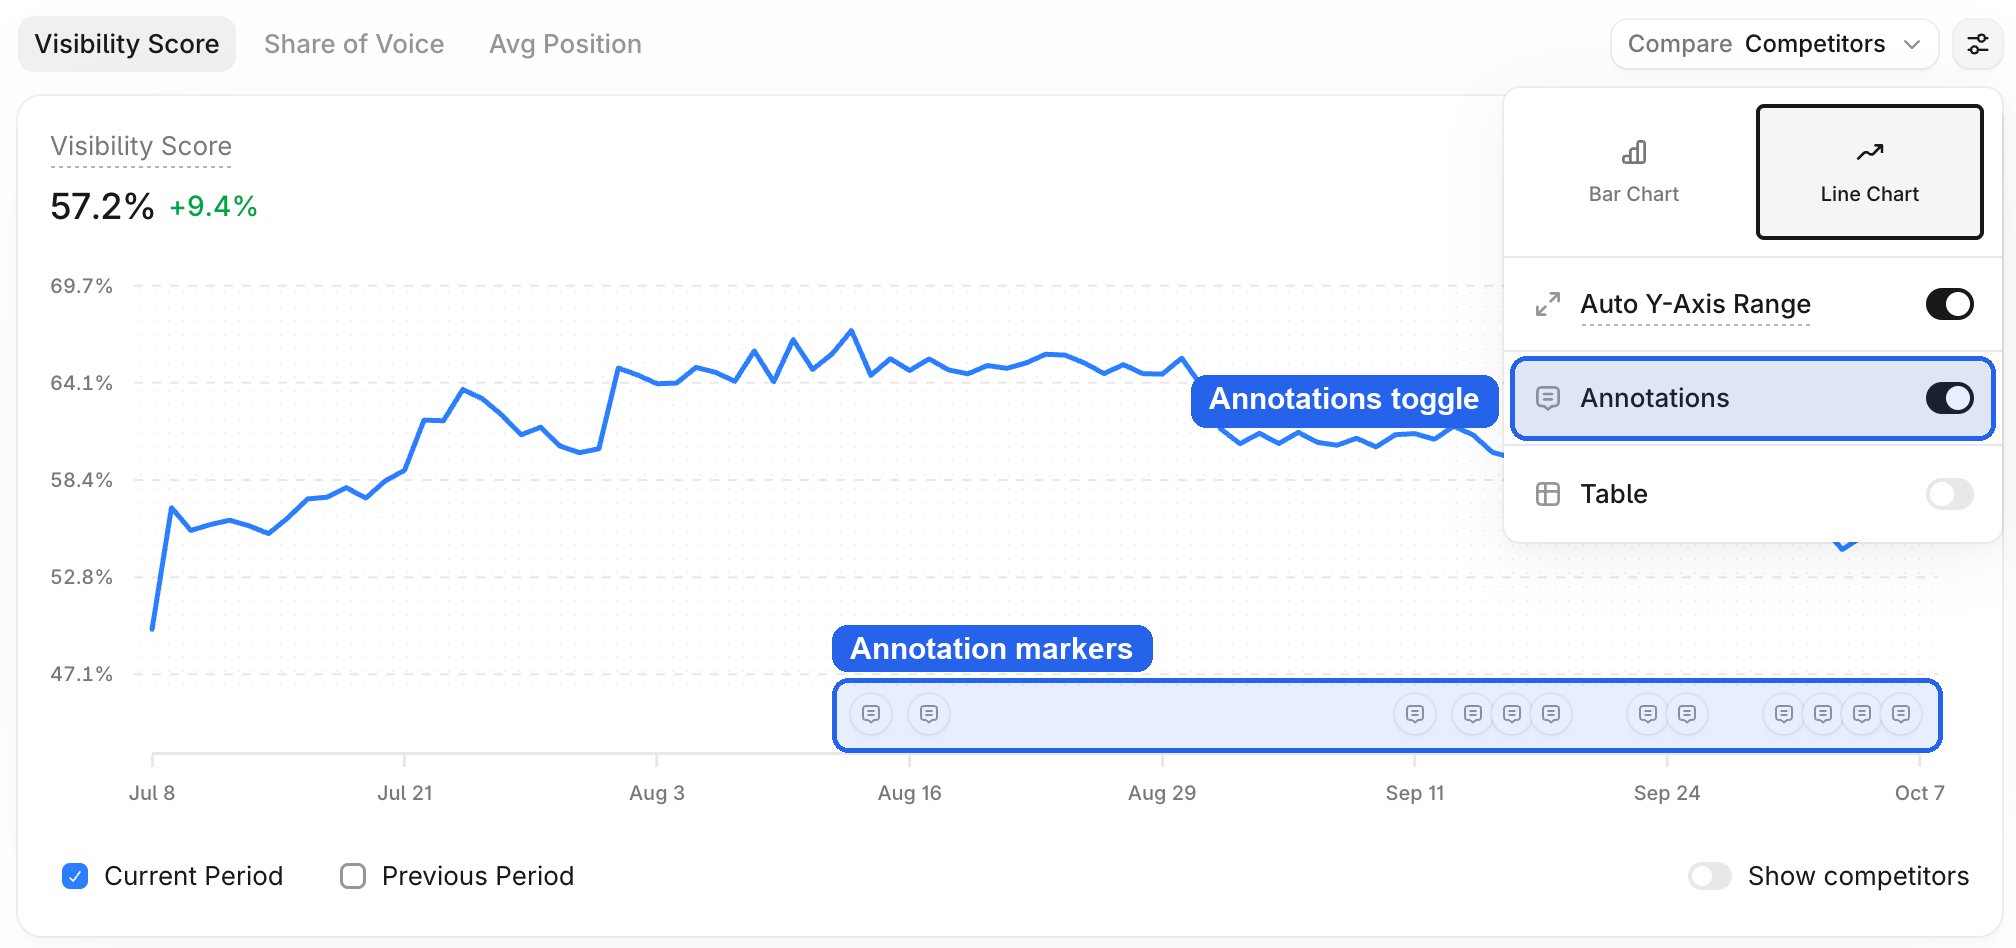
注釈は、[Answer Engine Insights](/ja-jp/answer-engine-insights/about) のすべての時系列折れ線グラフに表示されます。AI Marketer (Aim) も、生成する折れ線グラフに注釈を表示できます。
1. 折れ線グラフの下部にある注釈マーカーを見つけます。
2. マーカーを選択すると、その日付のすべての注釈が新しい順に表示されます。日付が近い場合、マーカーは 1 つにまとめられます。
注釈を非表示にするには、チャートの設定(スライダーアイコン)を開き、**Annotations** をオフにします。
 ## 注釈の種類
### ユーザー注釈
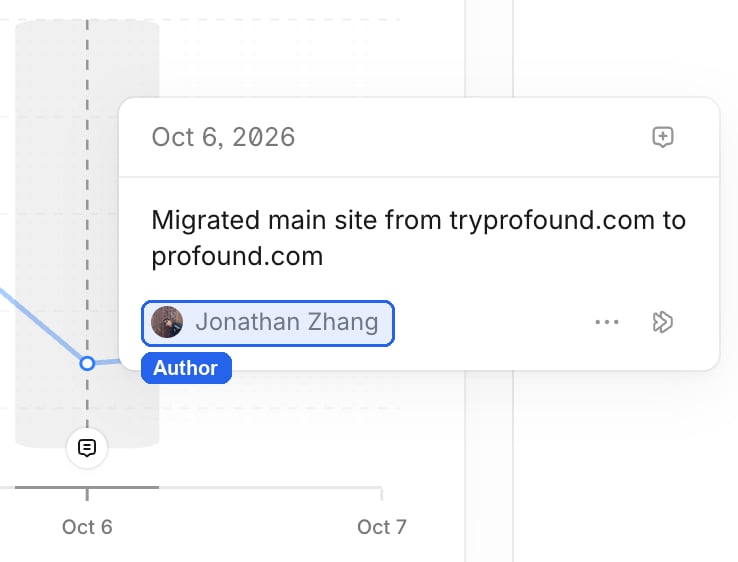
組織内のユーザーが作成します。チームが記録したいあらゆる内容を表示します。
## 注釈の種類
### ユーザー注釈
組織内のユーザーが作成します。チームが記録したいあらゆる内容を表示します。
 ### プラットフォームの更新
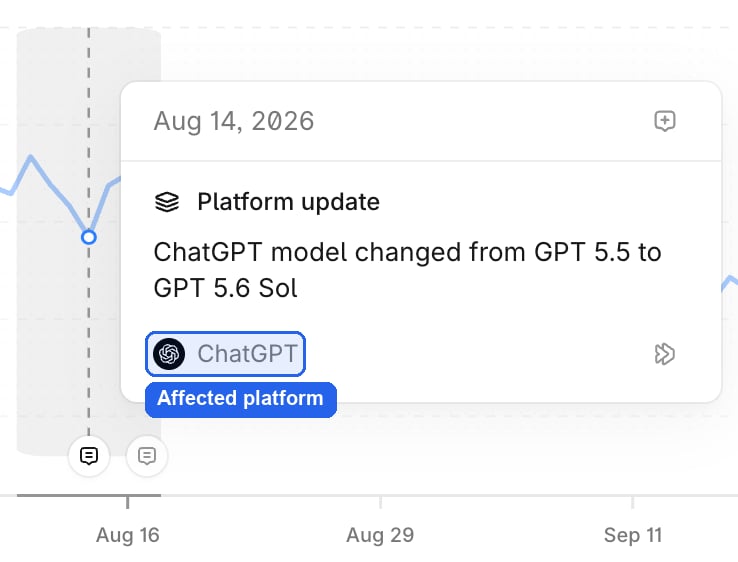
新しい ChatGPT モデルなど、Profound が追跡している AI プラットフォームでモデルが変更されたときに、Profound が自動的に作成します。モデルフィルターでそのプラットフォームが選択されていない場合、プラットフォームの更新は非表示になります。
### プラットフォームの更新
新しい ChatGPT モデルなど、Profound が追跡している AI プラットフォームでモデルが変更されたときに、Profound が自動的に作成します。モデルフィルターでそのプラットフォームが選択されていない場合、プラットフォームの更新は非表示になります。
 ### プロンプトの更新
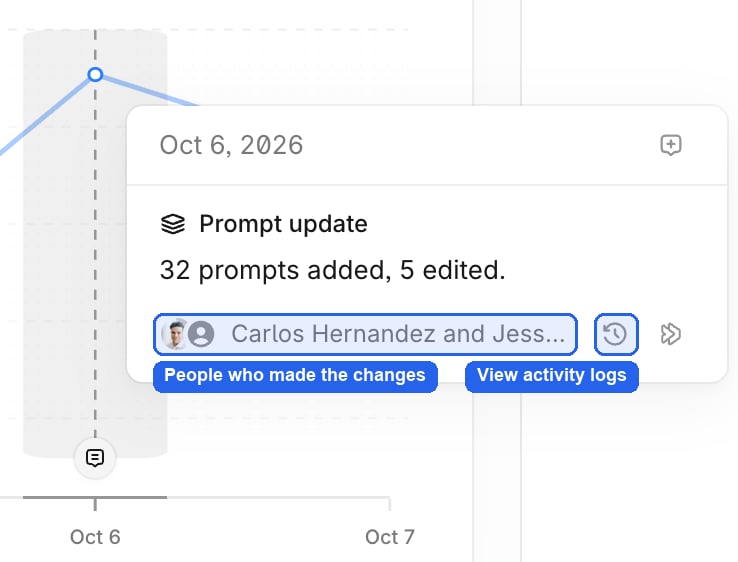
カテゴリ内のプロンプトの変更の日次サマリーとして、Profound が自動的に作成します(例: 「12 prompts added, 3 disabled」)。View Activity Logs 権限がある場合、プロンプトの更新には変更を行ったユーザーも表示され、**View activity logs** を選択すると Activity Logs で各変更を確認できます。
### プロンプトの更新
カテゴリ内のプロンプトの変更の日次サマリーとして、Profound が自動的に作成します(例: 「12 prompts added, 3 disabled」)。View Activity Logs 権限がある場合、プロンプトの更新には変更を行ったユーザーも表示され、**View activity logs** を選択すると Activity Logs で各変更を確認できます。
 ## 注釈を追加する
注釈は、次のいずれかの方法で追加できます。
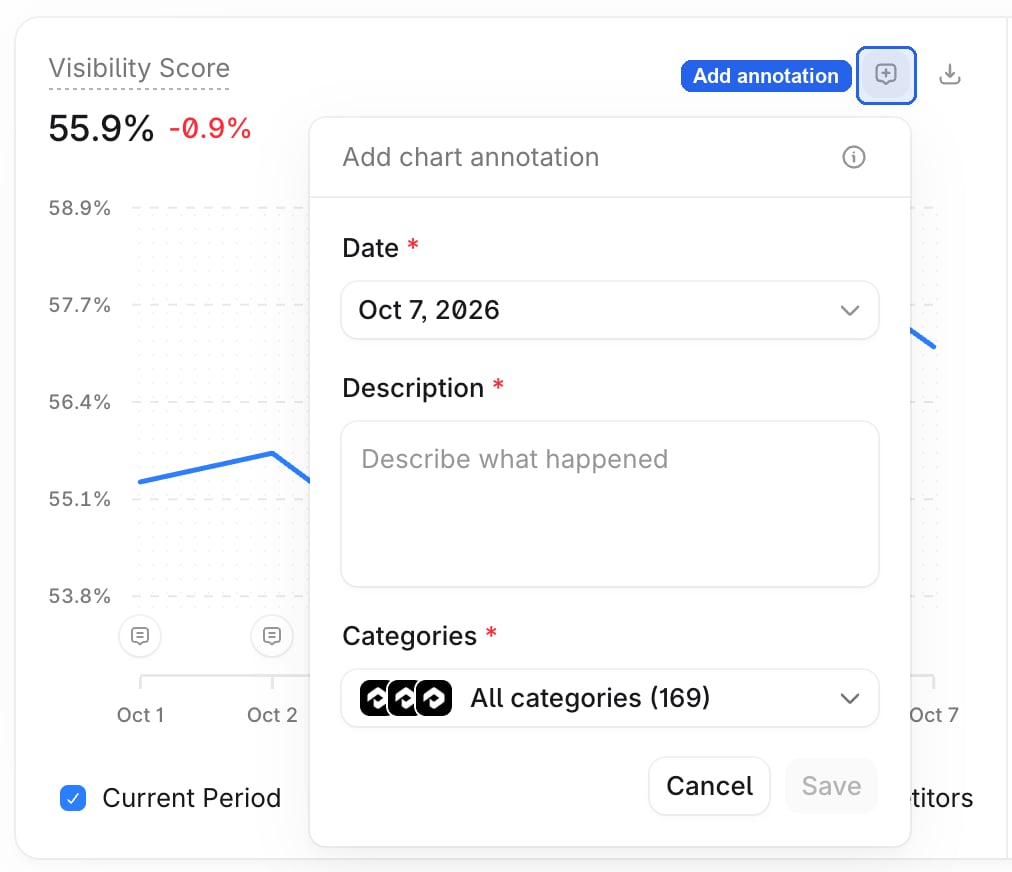
* チャート右上の **Add annotation** を選択します。日付は、選択した日付範囲の最終日がデフォルトになります。
## 注釈を追加する
注釈は、次のいずれかの方法で追加できます。
* チャート右上の **Add annotation** を選択します。日付は、選択した日付範囲の最終日がデフォルトになります。
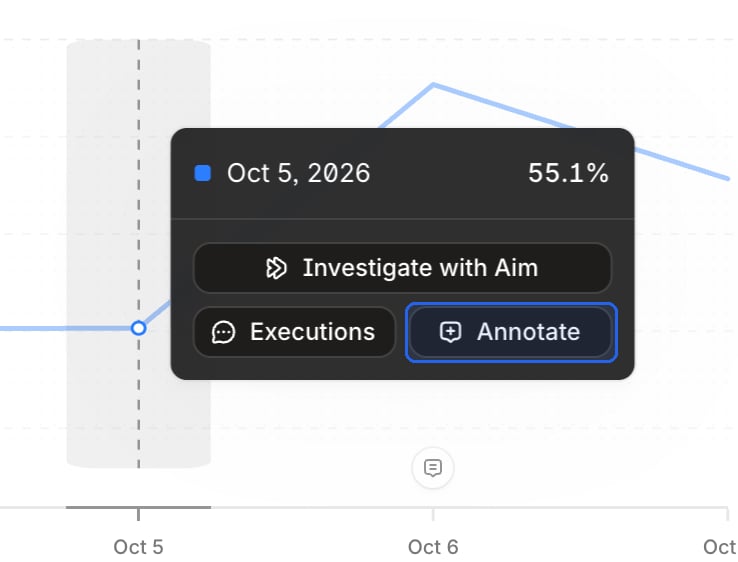
 * チャート上の特定の日付を選択して固定し、ツールチップで **Annotate** を選択します。
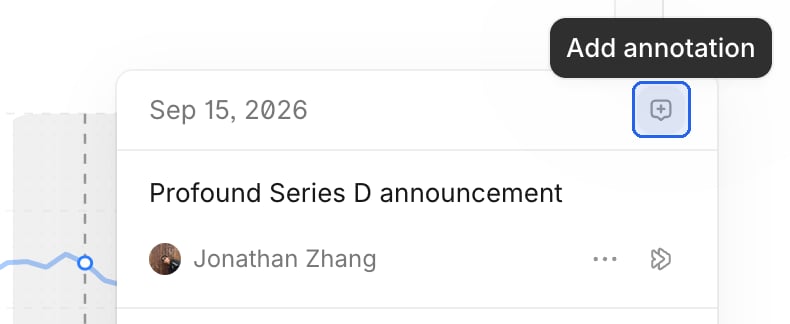
 * 開いている注釈リストで、日付の横にある **Add annotation** を選択します。
 **Add chart annotation** フォームに入力します。
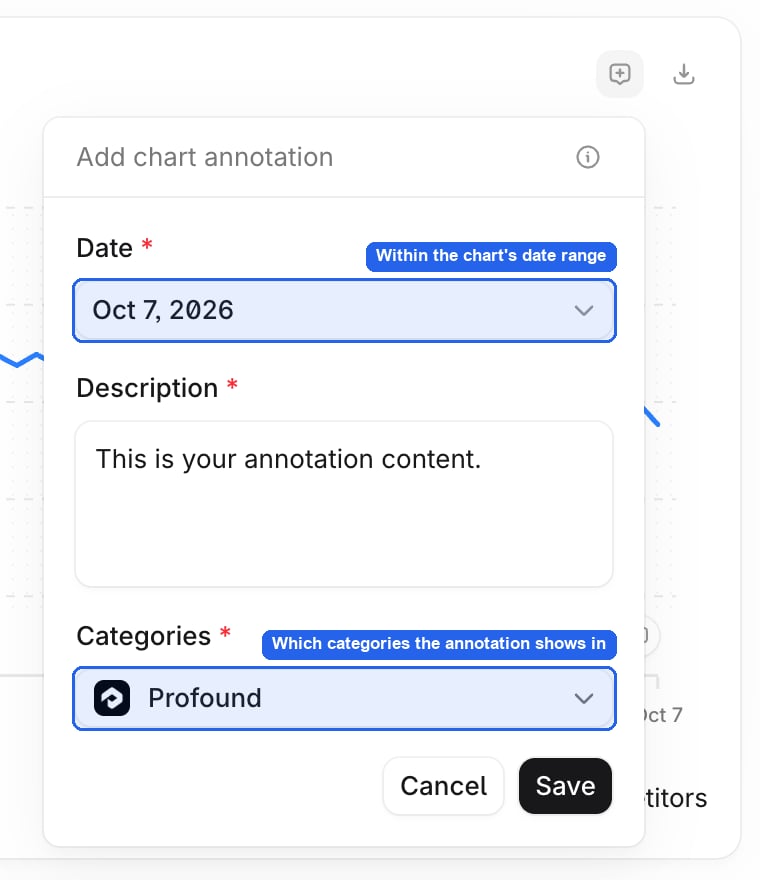 * **Date**: チャートで選択されている日付範囲内の任意の日付。範囲外の日付に注釈を付けるには、まず上部のフィルターで日付範囲を広げてください。
* **Description**: 何が起きたか。
* **Categories**: 注釈を表示する場所。デフォルトは **All categories** で、後から追加するカテゴリを含め、組織全体に適用されます。範囲を絞り込むには、特定のカテゴリを選択します。表示中のカテゴリは常に含まれます。
**Save** を選択します。注釈を閲覧できる組織内のすべてのユーザーに表示されます。
## 注釈を編集または削除する
編集または削除できるのは、自分が追加した注釈のみです。
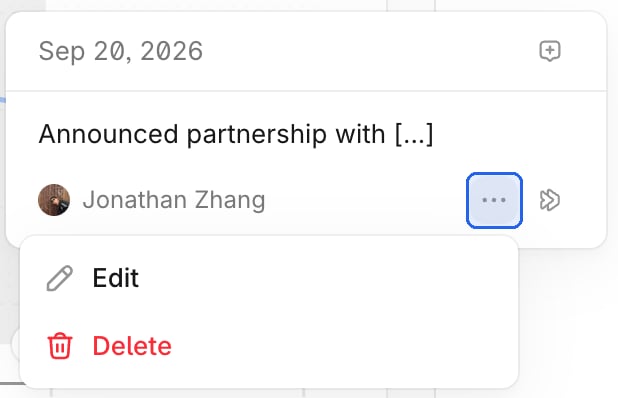
1. 注釈リストを開き、自分の注釈の横にある **…** を選択します。
2. 注釈を変更するには **Edit** を選択し、削除するには **Delete** を選択します。注釈の削除は元に戻せません。
プラットフォームの更新とプロンプトの更新は、編集や削除ができません。
* **Date**: チャートで選択されている日付範囲内の任意の日付。範囲外の日付に注釈を付けるには、まず上部のフィルターで日付範囲を広げてください。
* **Description**: 何が起きたか。
* **Categories**: 注釈を表示する場所。デフォルトは **All categories** で、後から追加するカテゴリを含め、組織全体に適用されます。範囲を絞り込むには、特定のカテゴリを選択します。表示中のカテゴリは常に含まれます。
**Save** を選択します。注釈を閲覧できる組織内のすべてのユーザーに表示されます。
## 注釈を編集または削除する
編集または削除できるのは、自分が追加した注釈のみです。
1. 注釈リストを開き、自分の注釈の横にある **…** を選択します。
2. 注釈を変更するには **Edit** を選択し、削除するには **Delete** を選択します。注釈の削除は元に戻せません。
プラットフォームの更新とプロンプトの更新は、編集や削除ができません。
 ## Aim で注釈を調査する
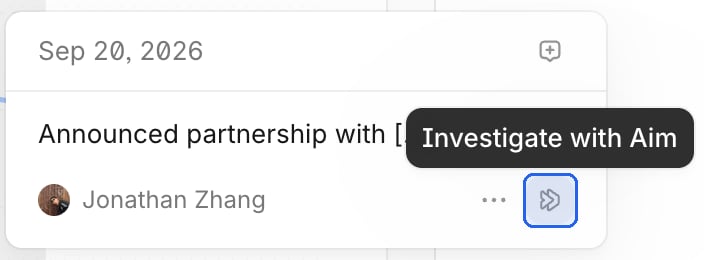
Aim にアクセスできる場合は、任意の注釈の横にある **Investigate with Aim** を選択します。Aim が注釈と表示中のチャートを読み込んだ状態で開き、そのイベントがメトリクスとどのように関連しているかの調査を開始します。
## Aim で注釈を調査する
Aim にアクセスできる場合は、任意の注釈の横にある **Investigate with Aim** を選択します。Aim が注釈と表示中のチャートを読み込んだ状態で開き、そのイベントがメトリクスとどのように関連しているかの調査を開始します。
 Answer Engine Insights のデータについて質問すると、Aim は注釈も読み取ることができます。
## 権限
詳しくは、[ロールと権限](/ja-jp/platform-config/people/roles-and-permissions)のドキュメントをご覧ください。
| ロール | 注釈とプロンプトの更新を表示 | 自分の注釈を追加、編集、削除 | プロンプトの更新を行ったユーザーを確認 |
| - | - | - | - |
| Admin | ✅ | ✅ | ✅ |
| Editor | ✅ | ✅ | ❌ |
| Member | ✅ | ❌ | ❌ |
| Viewer - AEI Only | ✅ | ❌ | ❌ |
| Viewer - AEI + AI Marketer | ✅ | ❌ | ❌ |
| Agent Operator | ✅ | ❌ | ❌ |
プロンプトの更新は、Enterprise プランで利用できる [Activity Logs](/ja-jp/platform-config/activity-logs/about) から取得されます。注釈を閲覧できるすべてのユーザーにプロンプトの更新が表示されますが、変更を行ったユーザーの確認や Activity Logs を開くには **View Activity Logs** 権限が必要です。Enterprise プランの Admin は、**View chart annotations** および **Create, edit, and delete custom chart annotations** 権限を使用したカスタムロールで、これらのデフォルトを変更できます。
注釈は組織に属し、カテゴリ単位の注釈はそのカテゴリを表示している場合にのみ表示されます。
Answer Engine Insights のデータについて質問すると、Aim は注釈も読み取ることができます。
## 権限
詳しくは、[ロールと権限](/ja-jp/platform-config/people/roles-and-permissions)のドキュメントをご覧ください。
| ロール | 注釈とプロンプトの更新を表示 | 自分の注釈を追加、編集、削除 | プロンプトの更新を行ったユーザーを確認 |
| - | - | - | - |
| Admin | ✅ | ✅ | ✅ |
| Editor | ✅ | ✅ | ❌ |
| Member | ✅ | ❌ | ❌ |
| Viewer - AEI Only | ✅ | ❌ | ❌ |
| Viewer - AEI + AI Marketer | ✅ | ❌ | ❌ |
| Agent Operator | ✅ | ❌ | ❌ |
プロンプトの更新は、Enterprise プランで利用できる [Activity Logs](/ja-jp/platform-config/activity-logs/about) から取得されます。注釈を閲覧できるすべてのユーザーにプロンプトの更新が表示されますが、変更を行ったユーザーの確認や Activity Logs を開くには **View Activity Logs** 権限が必要です。Enterprise プランの Admin は、**View chart annotations** および **Create, edit, and delete custom chart annotations** 権限を使用したカスタムロールで、これらのデフォルトを変更できます。
注釈は組織に属し、カテゴリ単位の注釈はそのカテゴリを表示している場合にのみ表示されます。