> ## Documentation Index
> Fetch the complete documentation index at: https://docs.tryprofound.com/llms.txt
> Use this file to discover all available pages before exploring further.
# Command Center を使い始める
> Command Center を開き、導入状況と利用状況の指標を確認します
## ステップ 1:Command Center を開く
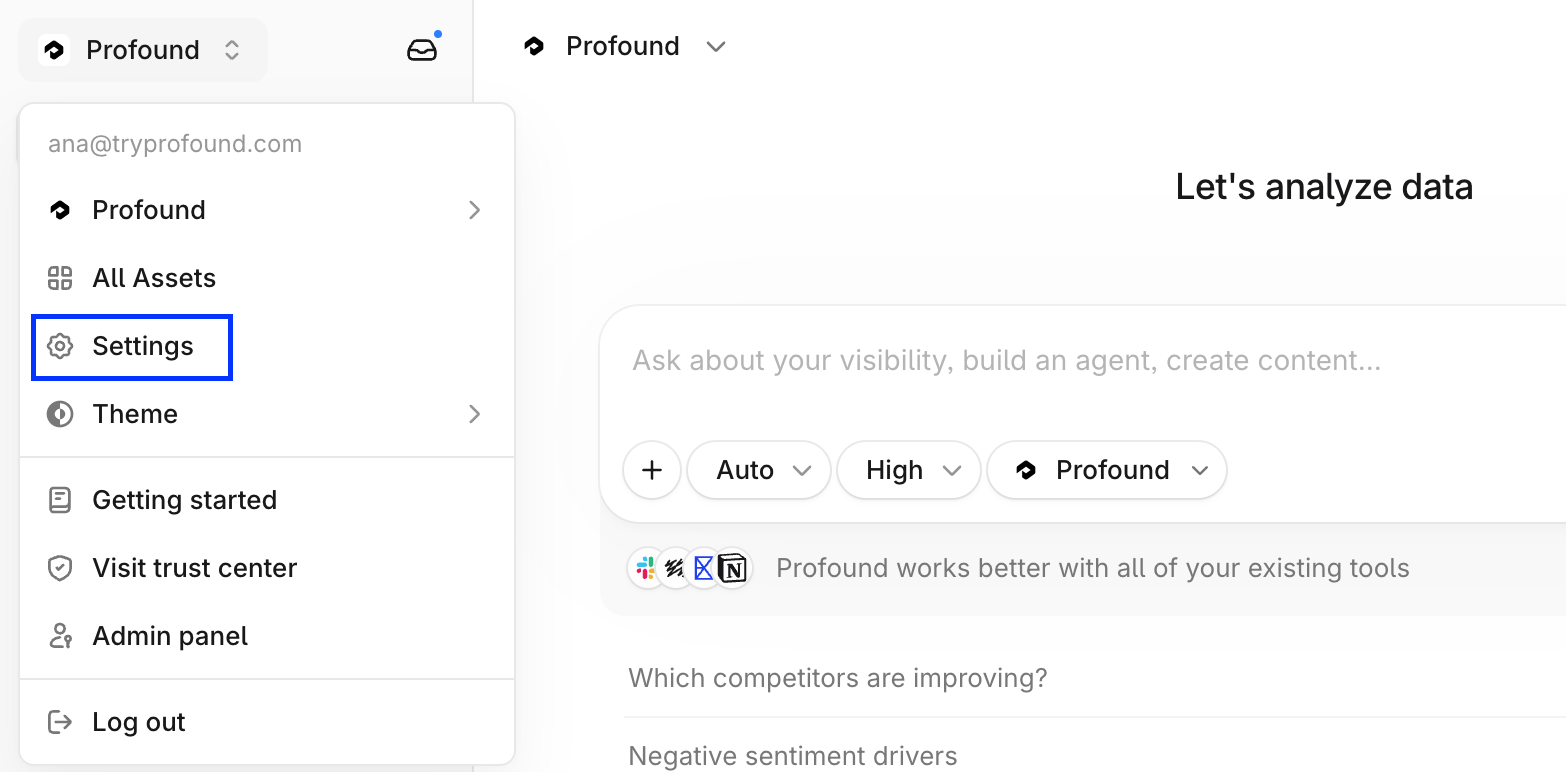
プラットフォーム左上の組織名を選択し、**Settings** を選択します。
 左側のナビゲーションサイドバーで、**Organization** の下にある **Command Center** を選択します。
## ステップ 2:チームの利用状況を確認する
* **Overall Performance** のグラフ(**Active Users**、**Agent Runs**、**Total Hours Saved**、**Projects Tracked**)に目を通します。
* 次に、**Platform Usage** の指標(**Power Users** リーダーボードと **Agent Usage by Category**)を確認します。
* **View** フィルターを使用して、**Total**(全期間の指標)と **Time Frame**(設定した期間の指標)を切り替えます。
## ステップ 3:平均処理時間の値をカスタマイズする
* **Total Hours Saved** カードの **Expand** を選択します。
左側のナビゲーションサイドバーで、**Organization** の下にある **Command Center** を選択します。
## ステップ 2:チームの利用状況を確認する
* **Overall Performance** のグラフ(**Active Users**、**Agent Runs**、**Total Hours Saved**、**Projects Tracked**)に目を通します。
* 次に、**Platform Usage** の指標(**Power Users** リーダーボードと **Agent Usage by Category**)を確認します。
* **View** フィルターを使用して、**Total**(全期間の指標)と **Time Frame**(設定した期間の指標)を切り替えます。
## ステップ 3:平均処理時間の値をカスタマイズする
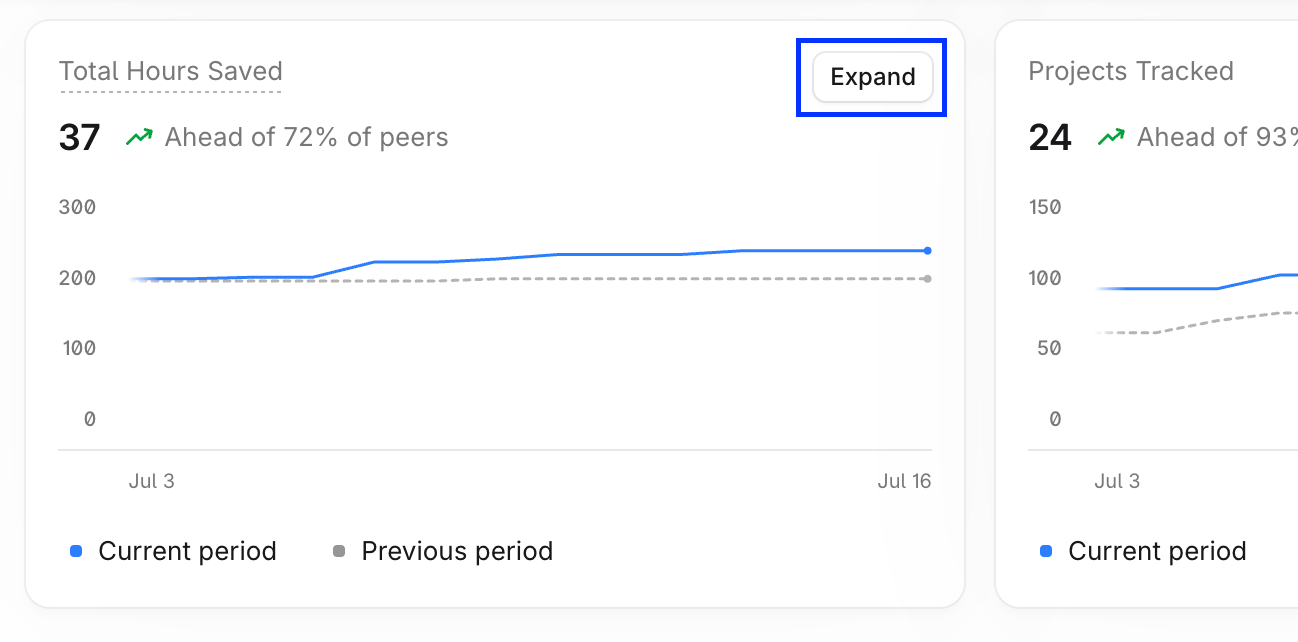
* **Total Hours Saved** カードの **Expand** を選択します。
 * **Total Hours Saved Breakdown** で **Edit Average Process Time** を選択します。
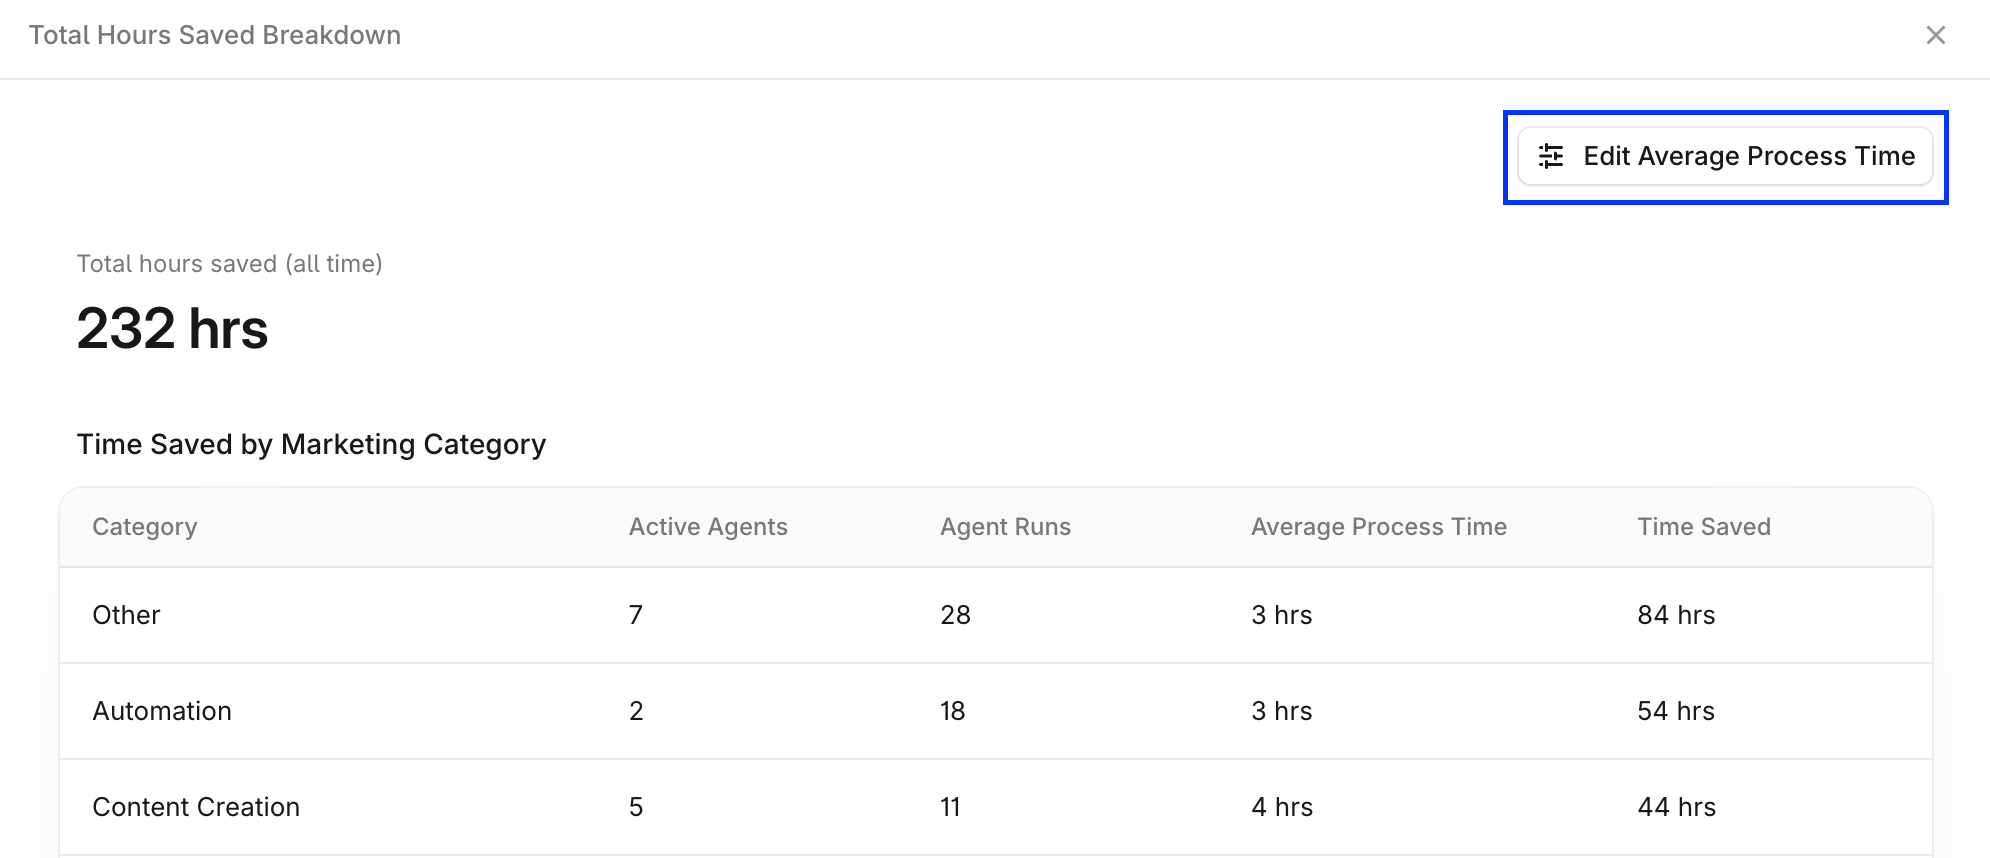 * カテゴリごとの時間を調整し、削減時間の数値がチームでの実際のタスク所要時間を反映するようにします。
## ステップ 4:ベンチマークを設定する
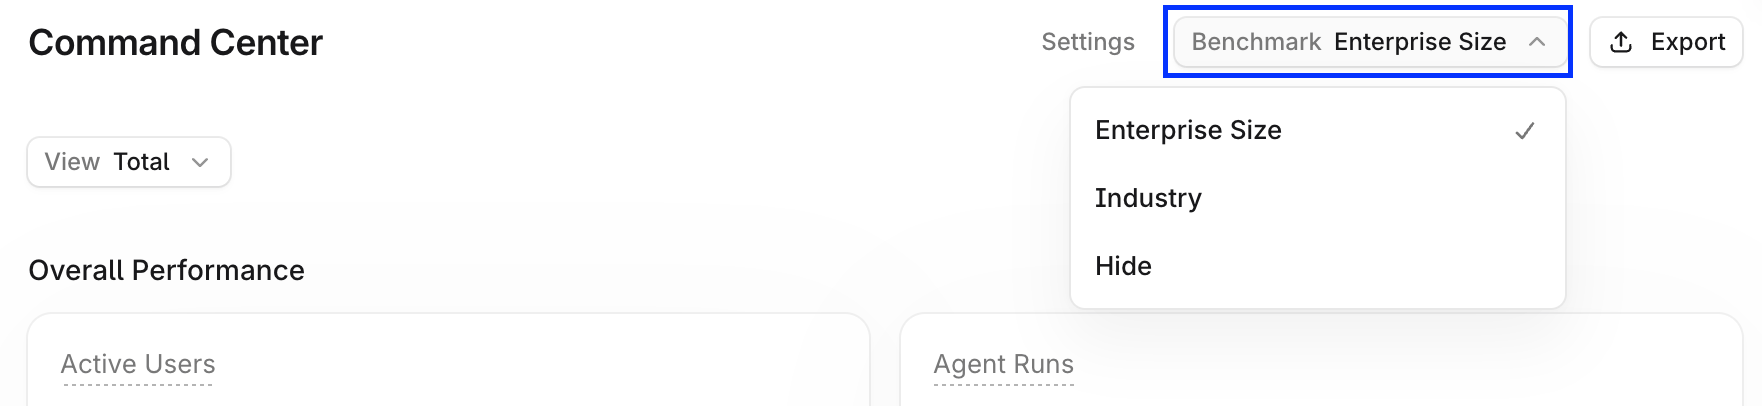
**Benchmark** フィルターを使用して、**Enterprise Size**(企業規模)または **Industry**(業界)で指標を比較します。比較なしで自社の数値のみを表示したい場合は、**Hide** を選択します。
* カテゴリごとの時間を調整し、削減時間の数値がチームでの実際のタスク所要時間を反映するようにします。
## ステップ 4:ベンチマークを設定する
**Benchmark** フィルターを使用して、**Enterprise Size**(企業規模)または **Industry**(業界)で指標を比較します。比較なしで自社の数値のみを表示したい場合は、**Hide** を選択します。
 ## ステップ 5:エクスポートして共有する
**Export** を選択してダッシュボードをダウンロードするか、Power Users のランキング(**Power Users** > **View all users**)をダウンロードして、導入状況のハイライトをチームと共有します。
## ステップ 5:エクスポートして共有する
**Export** を選択してダッシュボードをダウンロードするか、Power Users のランキング(**Power Users** > **View all users**)をダウンロードして、導入状況のハイライトをチームと共有します。