> ## Documentation Index
> Fetch the complete documentation index at: https://docs.tryprofound.com/llms.txt
> Use this file to discover all available pages before exploring further.
# Analyze prompt volumes
> Read the Relevant Prompts, Intent, Demographics, and Keyword Hierarchy tabs and apply filters in Prompt Volumes
Submitting a keyword query, or selecting a keyword from a list, redirects you to the corresponding results within the Prompt Volumes dataset. From there, you can review several charts and tables that show how frequently your keywords appear across different answer engine platforms. These visualizations are organized into the following tabs: Relevant Prompts, Keyword Lists, Prompt Research Reports.
## Relevant Prompts tab
Three main charts and tables provide an overview of your keyword query results. Use these to understand the volume of prompts that contain your queried keywords.
### Prompt Volumes
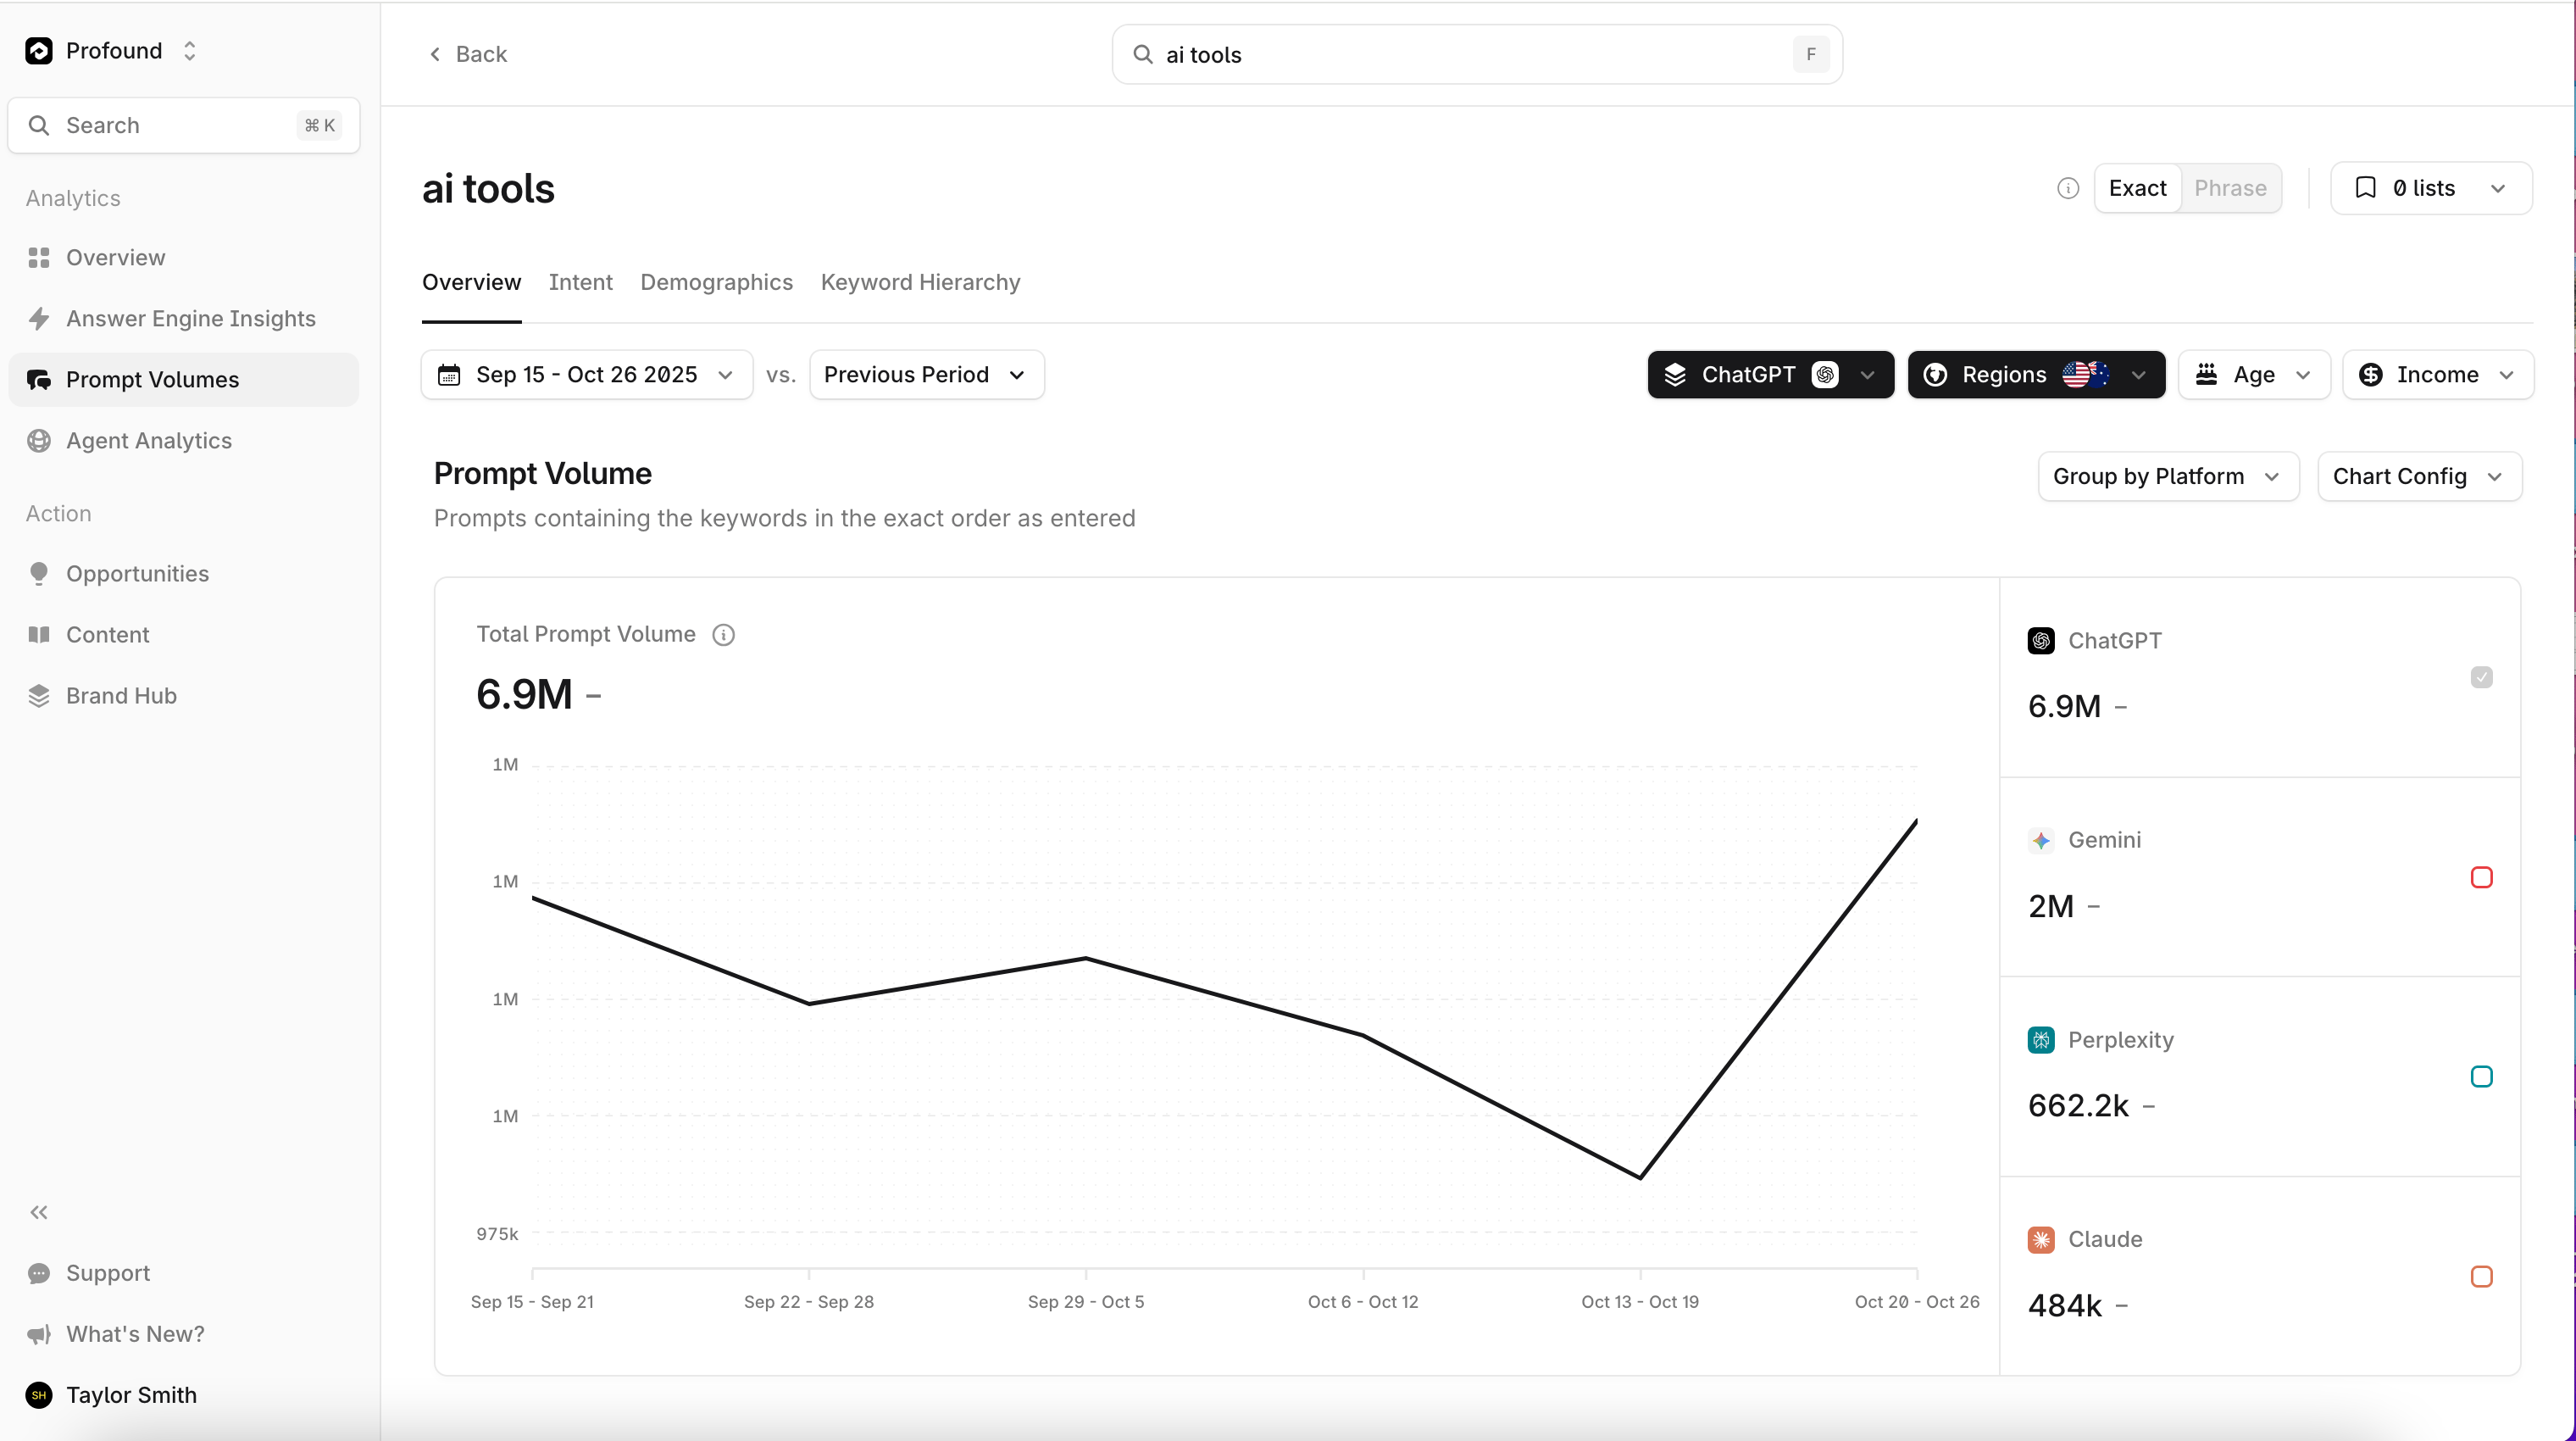
The Prompt Volumes chart shows how many keyword matches were found in the prompt dataset.
Adjust the visualization using the Chart Config controls above the chart. Display results as either a line or bar chart, and group results by platform, age, or income.
 ### Relevant Prompts
The Relevant Prompts table lists the prompts included in your results. This provides a more granular view of the specific questions passed to answer engines that contain your keyword.
### Similar Keywords
The Similar Keywords table displays keywords that commonly appear in similar prompting patterns. Select any keyword in this list to run a new query for that term.
## Intent
The Intent tab displays a chart showing the share of conversations by intent, based on a representative sample of user conversation data over the last 90 days. Profound classifies intent as informational, commercial, conversational, or generative (requests to create content).
### Relevant Prompts
The Relevant Prompts table lists the prompts included in your results. This provides a more granular view of the specific questions passed to answer engines that contain your keyword.
### Similar Keywords
The Similar Keywords table displays keywords that commonly appear in similar prompting patterns. Select any keyword in this list to run a new query for that term.
## Intent
The Intent tab displays a chart showing the share of conversations by intent, based on a representative sample of user conversation data over the last 90 days. Profound classifies intent as informational, commercial, conversational, or generative (requests to create content).
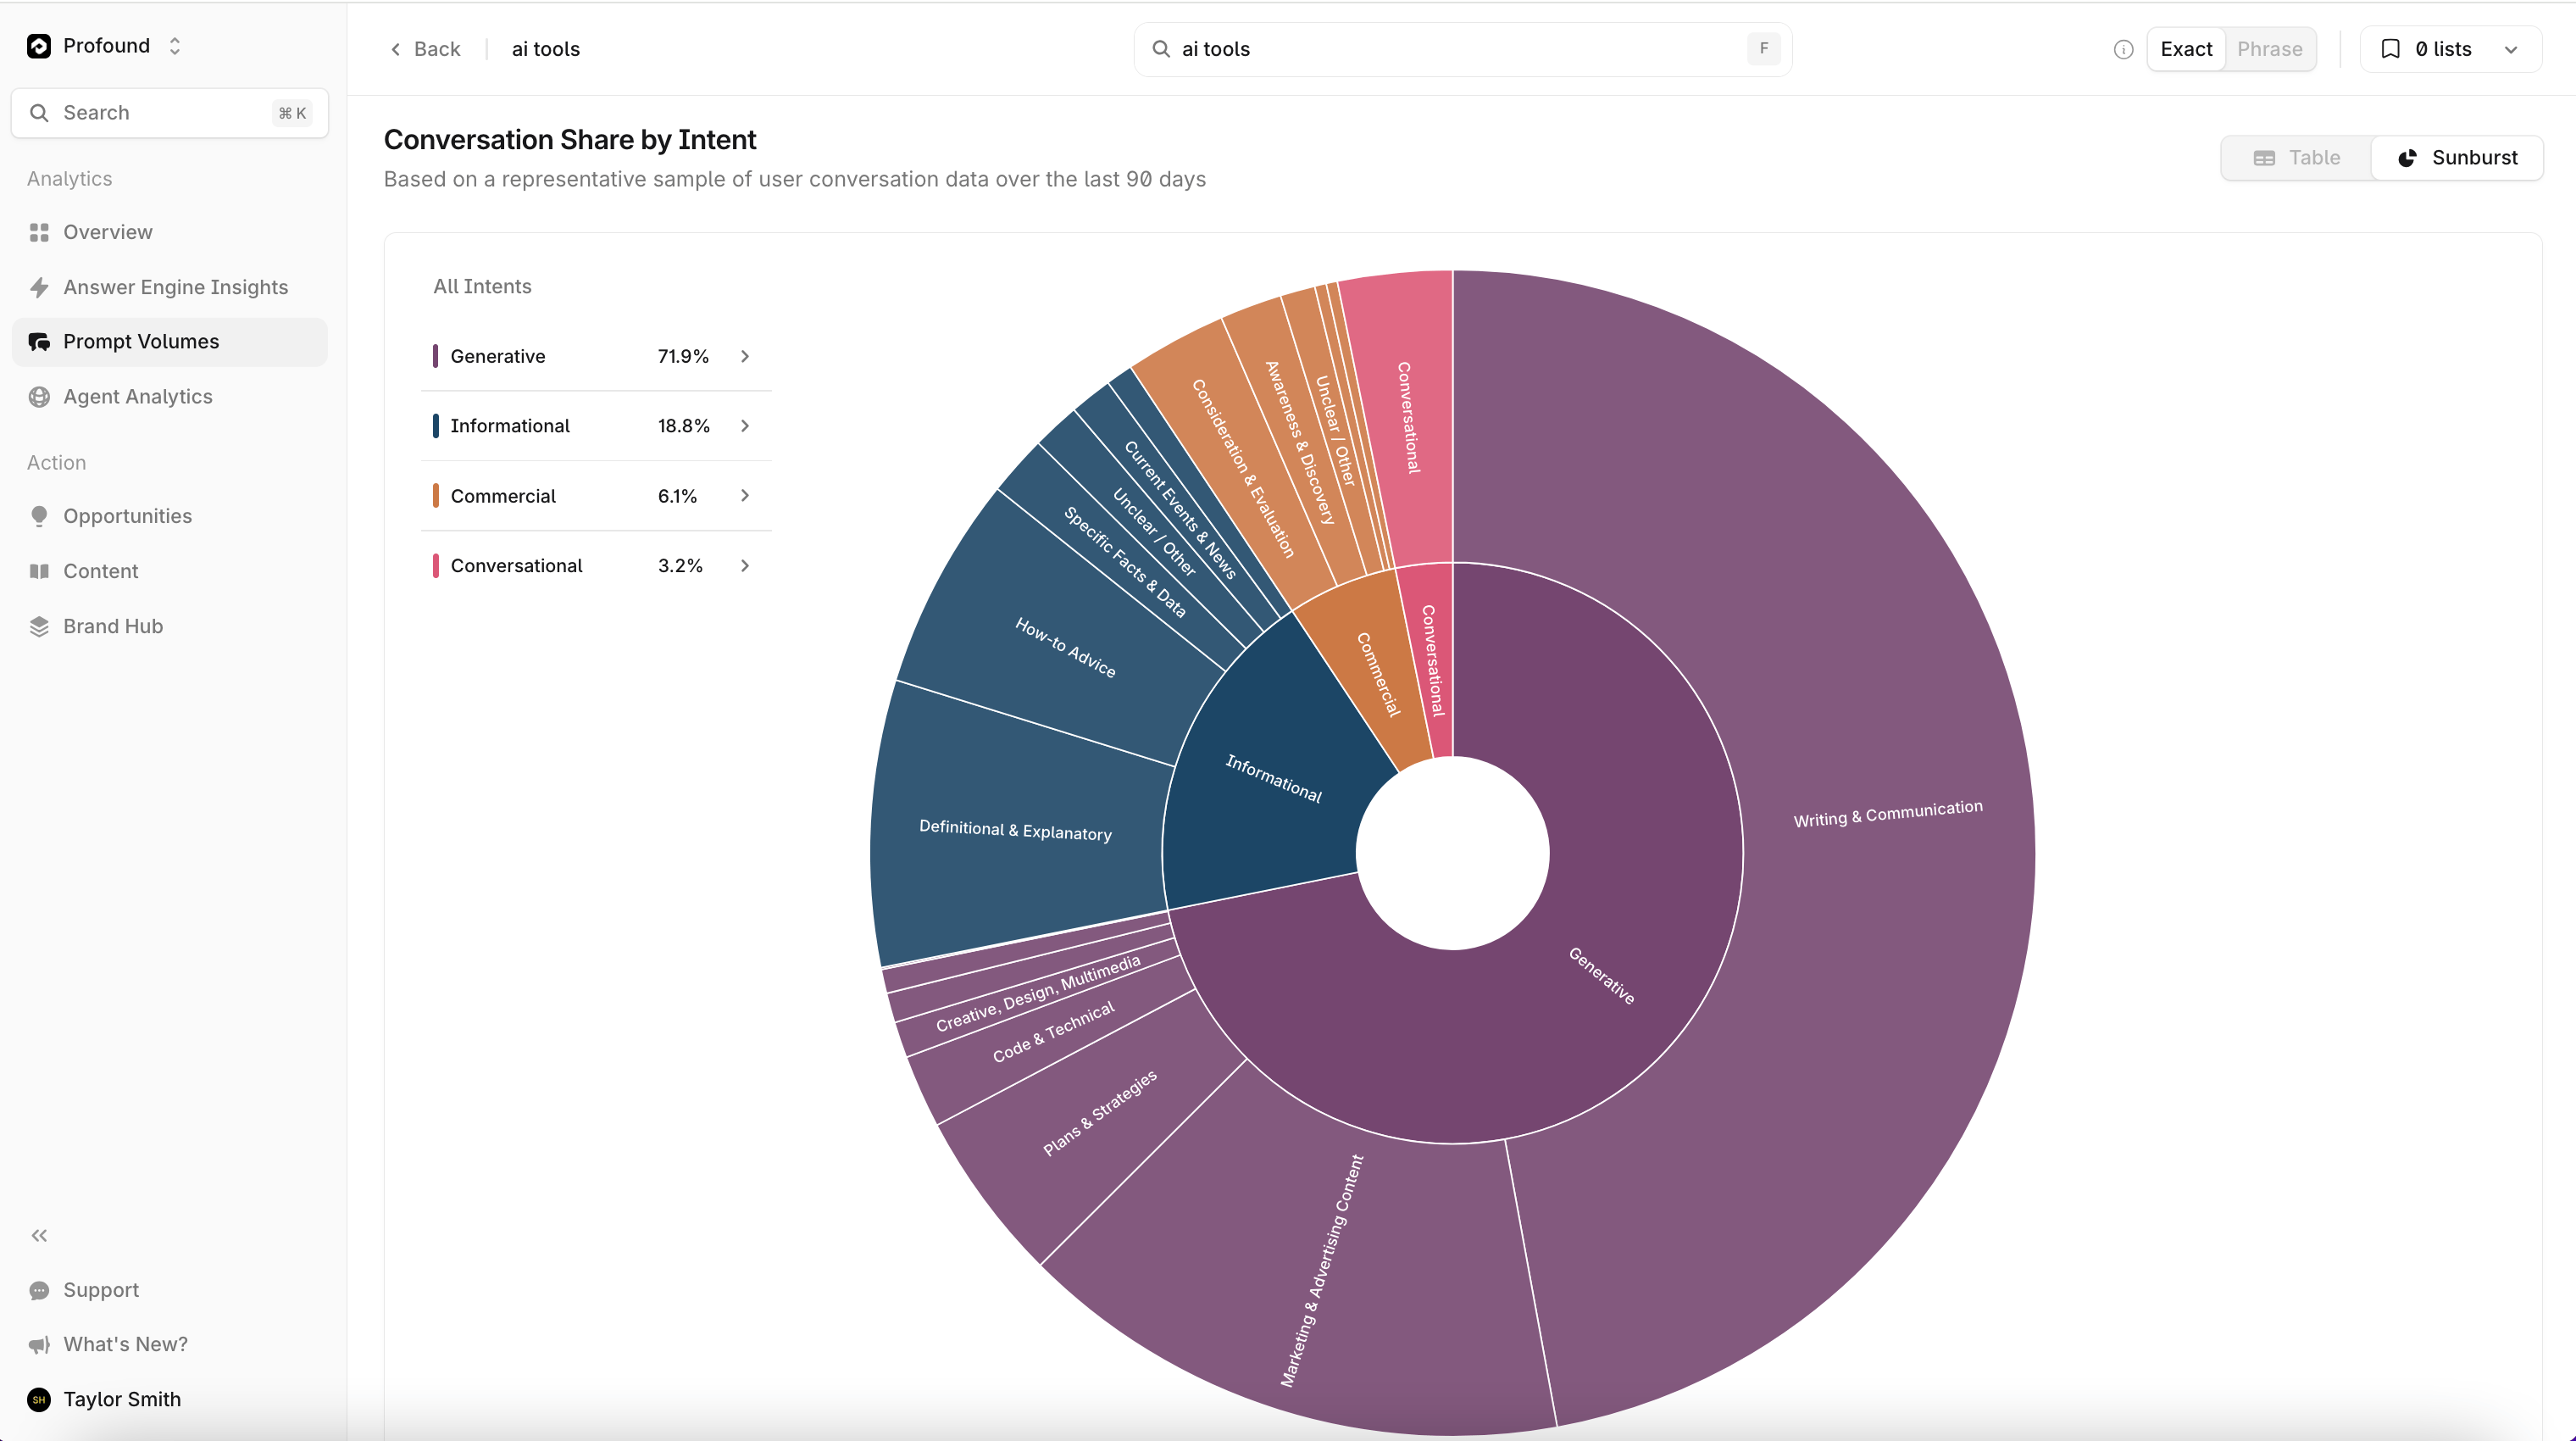 Switch between the sunburst chart and a table view using the toggle above the chart.
## Demographics
The Demographics tab displays keyword query results broken down by region, age, and annual income.
### Region
The Region chart is a heat map showing the volume of prompts containing the queried keyword across geographic regions. A table to the right lists the exact prompt counts for each region.
### Age
The Age chart groups prompt results by age ranges. View this data as either a bar chart or a table using the toggle above the chart.
### Annual income
The Annual Income chart groups prompt results by income ranges. View this data as either a bar chart or a table using the toggle above the chart.
## Keyword Hierarchy
The Keyword Hierarchy tab contains an interactive hierarchy chart. The queried keyword heads the chart. Subsequent levels show expanded keywords and their corresponding prevalence in the results.
Switch between the sunburst chart and a table view using the toggle above the chart.
## Demographics
The Demographics tab displays keyword query results broken down by region, age, and annual income.
### Region
The Region chart is a heat map showing the volume of prompts containing the queried keyword across geographic regions. A table to the right lists the exact prompt counts for each region.
### Age
The Age chart groups prompt results by age ranges. View this data as either a bar chart or a table using the toggle above the chart.
### Annual income
The Annual Income chart groups prompt results by income ranges. View this data as either a bar chart or a table using the toggle above the chart.
## Keyword Hierarchy
The Keyword Hierarchy tab contains an interactive hierarchy chart. The queried keyword heads the chart. Subsequent levels show expanded keywords and their corresponding prevalence in the results.
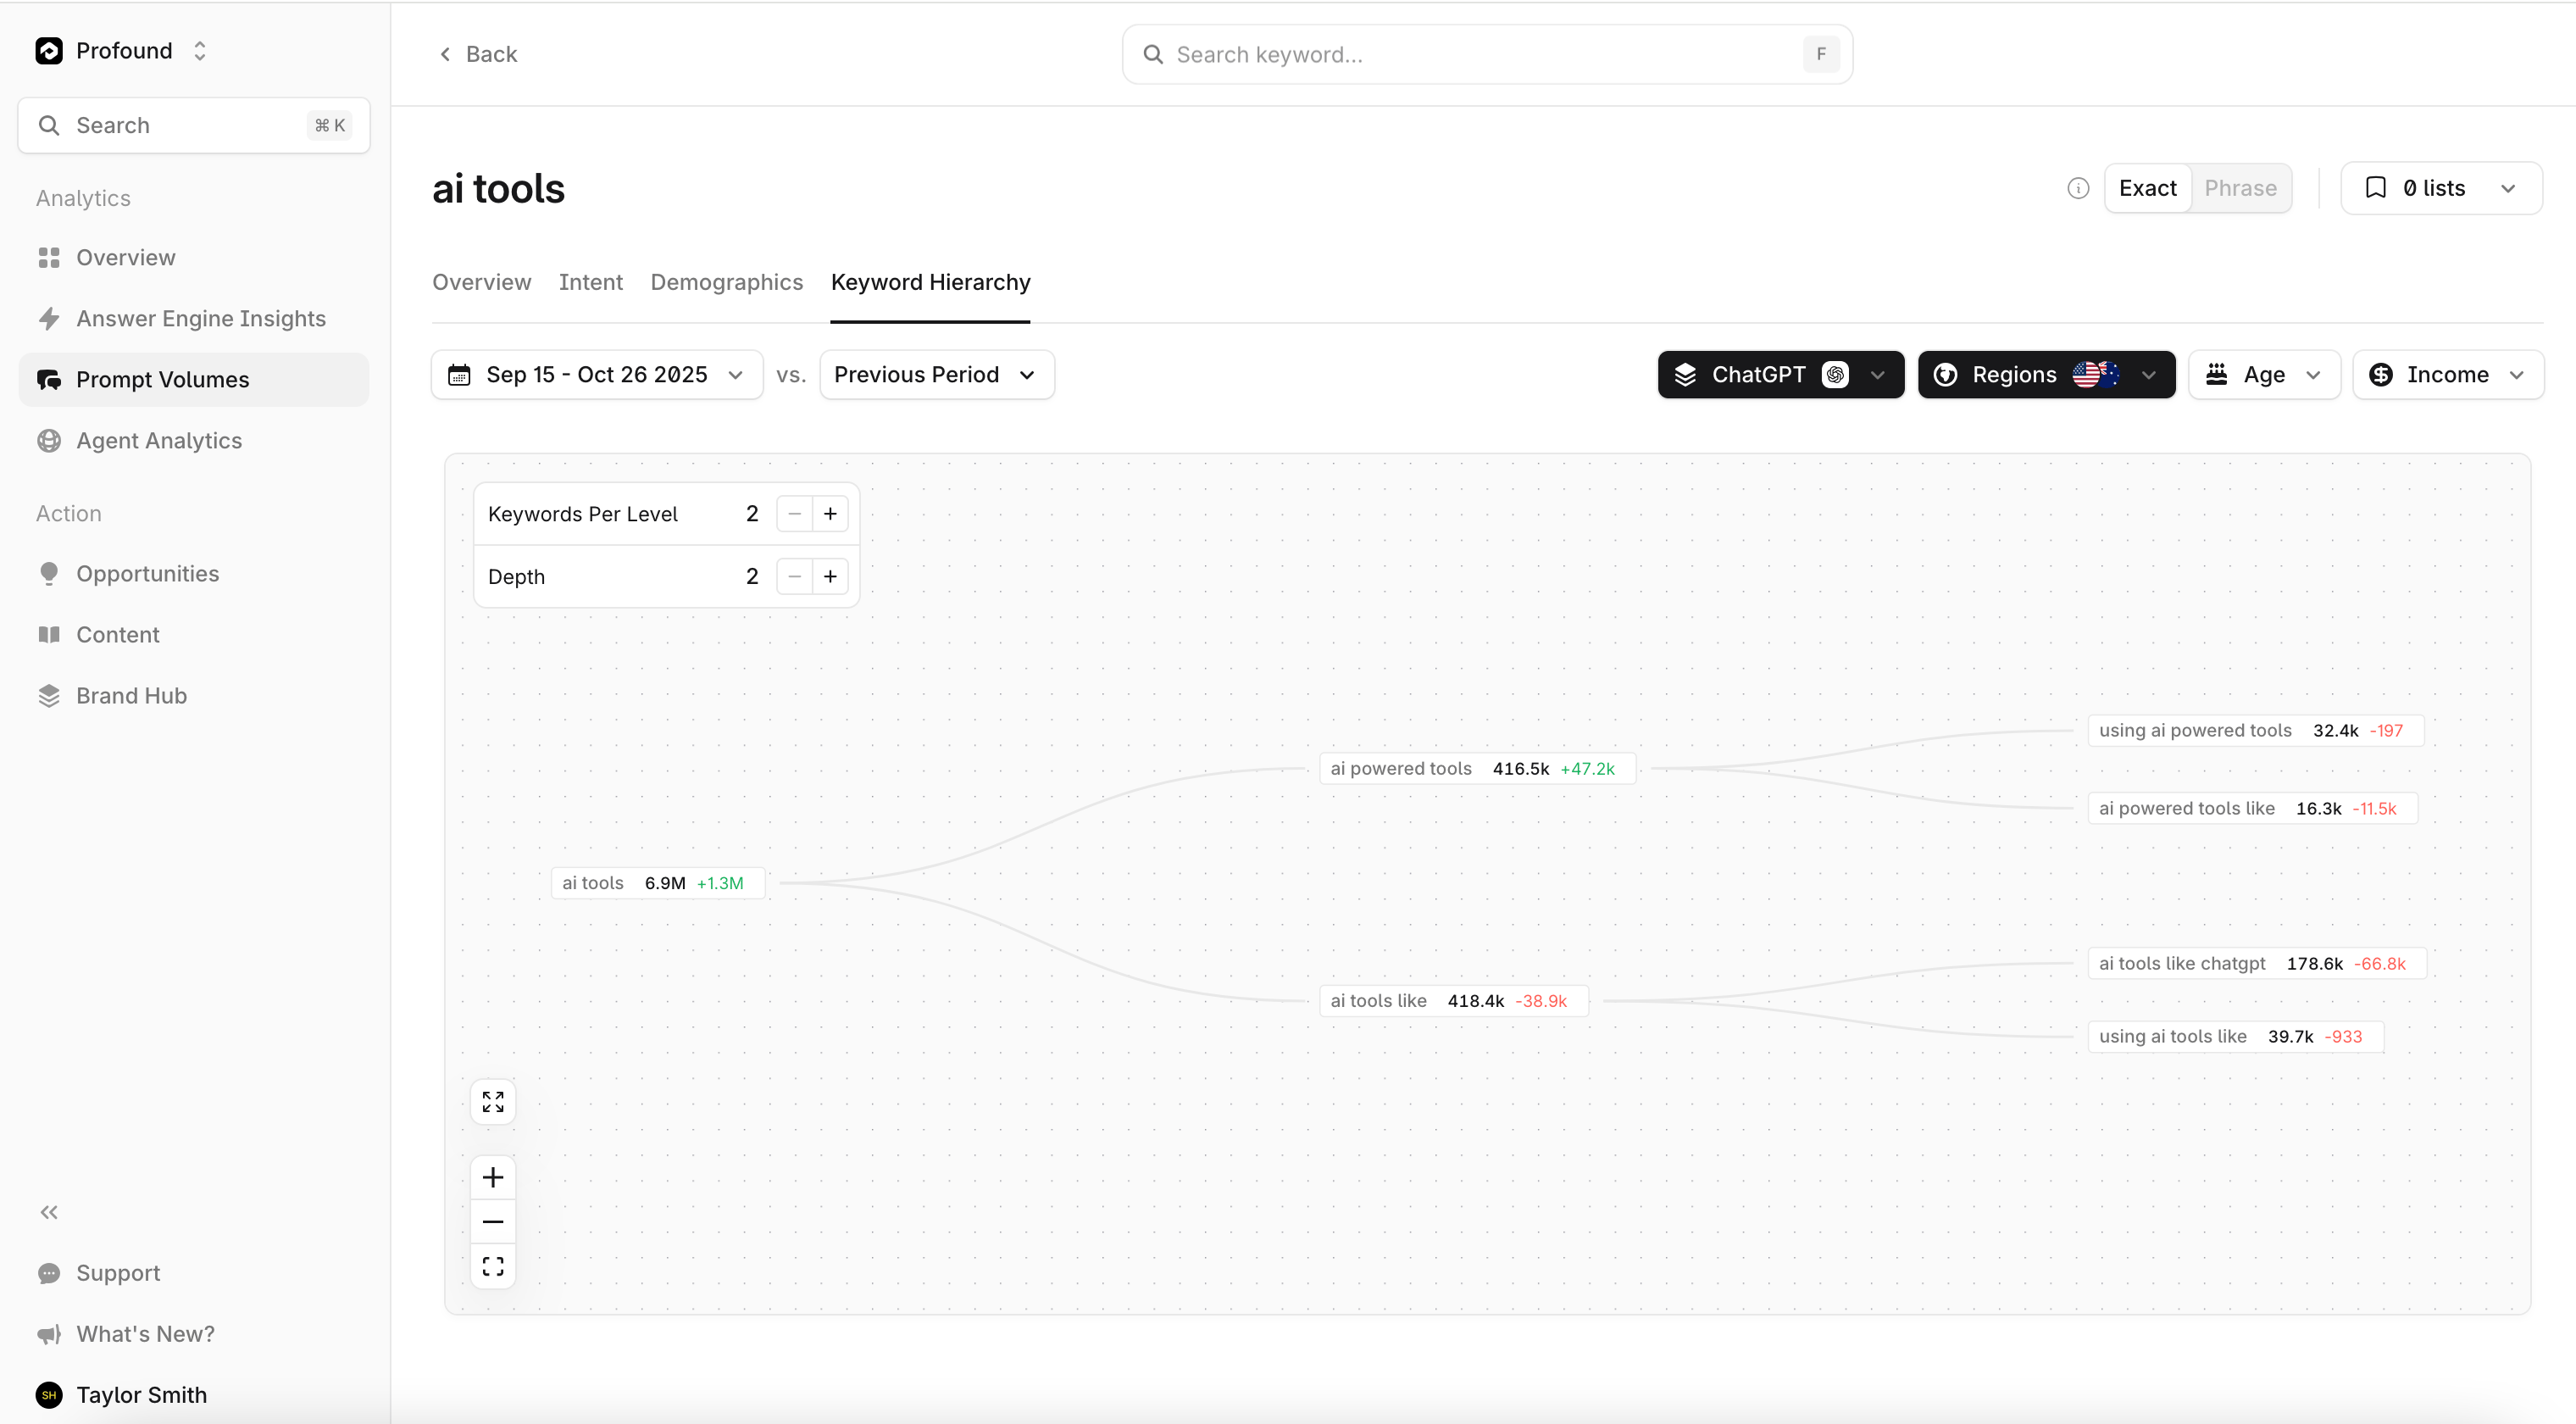 Adjust the number of keywords per level and depth of the hierarchy using the number stepper on the left side of the chart.
## Filters
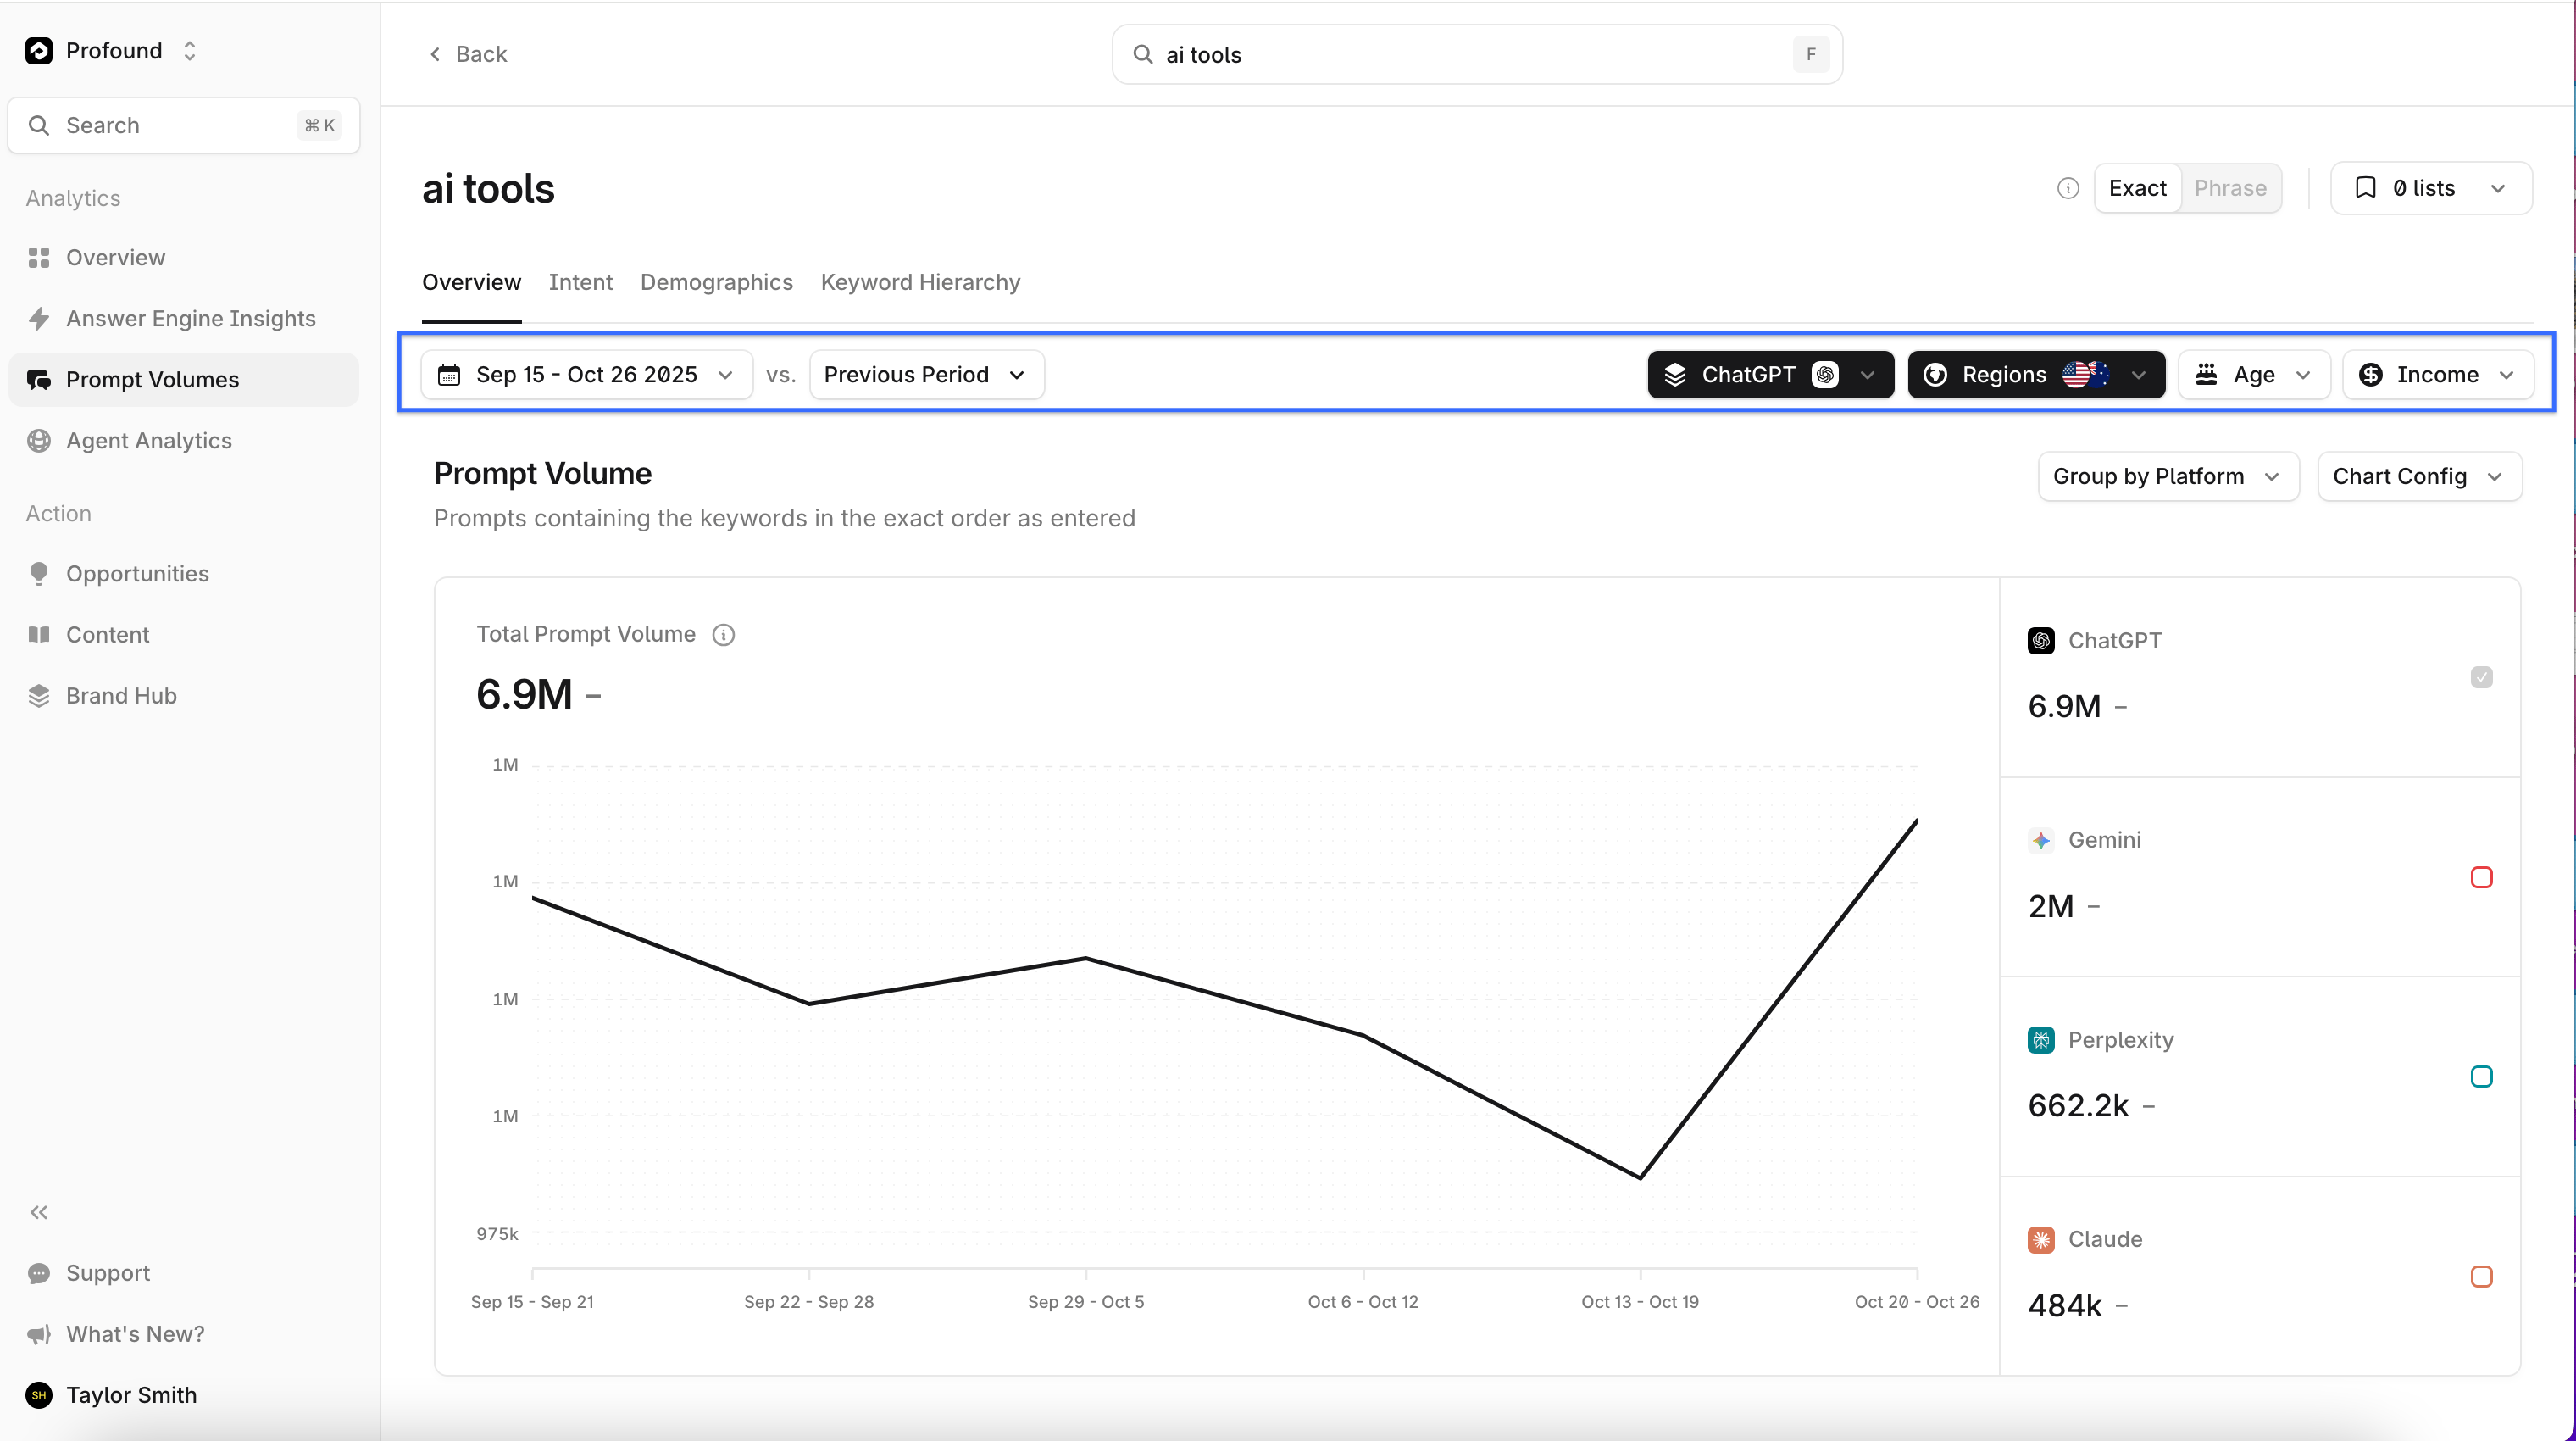
Filters are available across Prompt Volumes. They let you adjust the analytical time frame, narrow the data view, and apply groupings. Filters appear as dropdown menus beneath the top navigation bar.
Adjust the number of keywords per level and depth of the hierarchy using the number stepper on the left side of the chart.
## Filters
Filters are available across Prompt Volumes. They let you adjust the analytical time frame, narrow the data view, and apply groupings. Filters appear as dropdown menus beneath the top navigation bar.
 ### Date Range filter
Use the date range filter to select the time window for answer engine response collection. Choose a preset window (such as the previous 7 days) or define a custom range using the calendar cursor.
Only answer engine responses generated during the selected period appear in the Answer Engine Insights charts.
Charts display differences by calculating the change between the selected time frame and a previous period. Adjust this comparison period using the "Previous Time Period" dropdown.
### Attribute filters
Several attribute filters let you narrow chart data. While each chart includes filters relevant to its context, filter functionality is consistent across charts.
To adjust filters, open the dropdown for the desired attribute and select any attribute group to include in the chart view.
### Date Range filter
Use the date range filter to select the time window for answer engine response collection. Choose a preset window (such as the previous 7 days) or define a custom range using the calendar cursor.
Only answer engine responses generated during the selected period appear in the Answer Engine Insights charts.
Charts display differences by calculating the change between the selected time frame and a previous period. Adjust this comparison period using the "Previous Time Period" dropdown.
### Attribute filters
Several attribute filters let you narrow chart data. While each chart includes filters relevant to its context, filter functionality is consistent across charts.
To adjust filters, open the dropdown for the desired attribute and select any attribute group to include in the chart view.