> ## Documentation Index
> Fetch the complete documentation index at: https://docs.tryprofound.com/llms.txt
> Use this file to discover all available pages before exploring further.
# Answer Engine Insights
> Sample requests for Answer Engine Insights endpoints.
This guide provides practical examples of common API requests. All examples use JSON format and require authentication via API key.
Replace `your_api_key`, `your_category_id`, and `your_company_name` with your
actual values. Category IDs can be obtained from `/v1/org/categories`.
All examples use simplified date formats. For production use, please read [Date Ranges & Timezones](/rest-api/date-ranges) to understand timezone handling and avoid common pitfalls with date parameters.
## Visibility Reports
Retrieve visibility metrics and performance data for companies within specific categories. See the full [endpoint reference](/api-reference/reports/query-visibility) for all available metrics, dimensions, and filters.
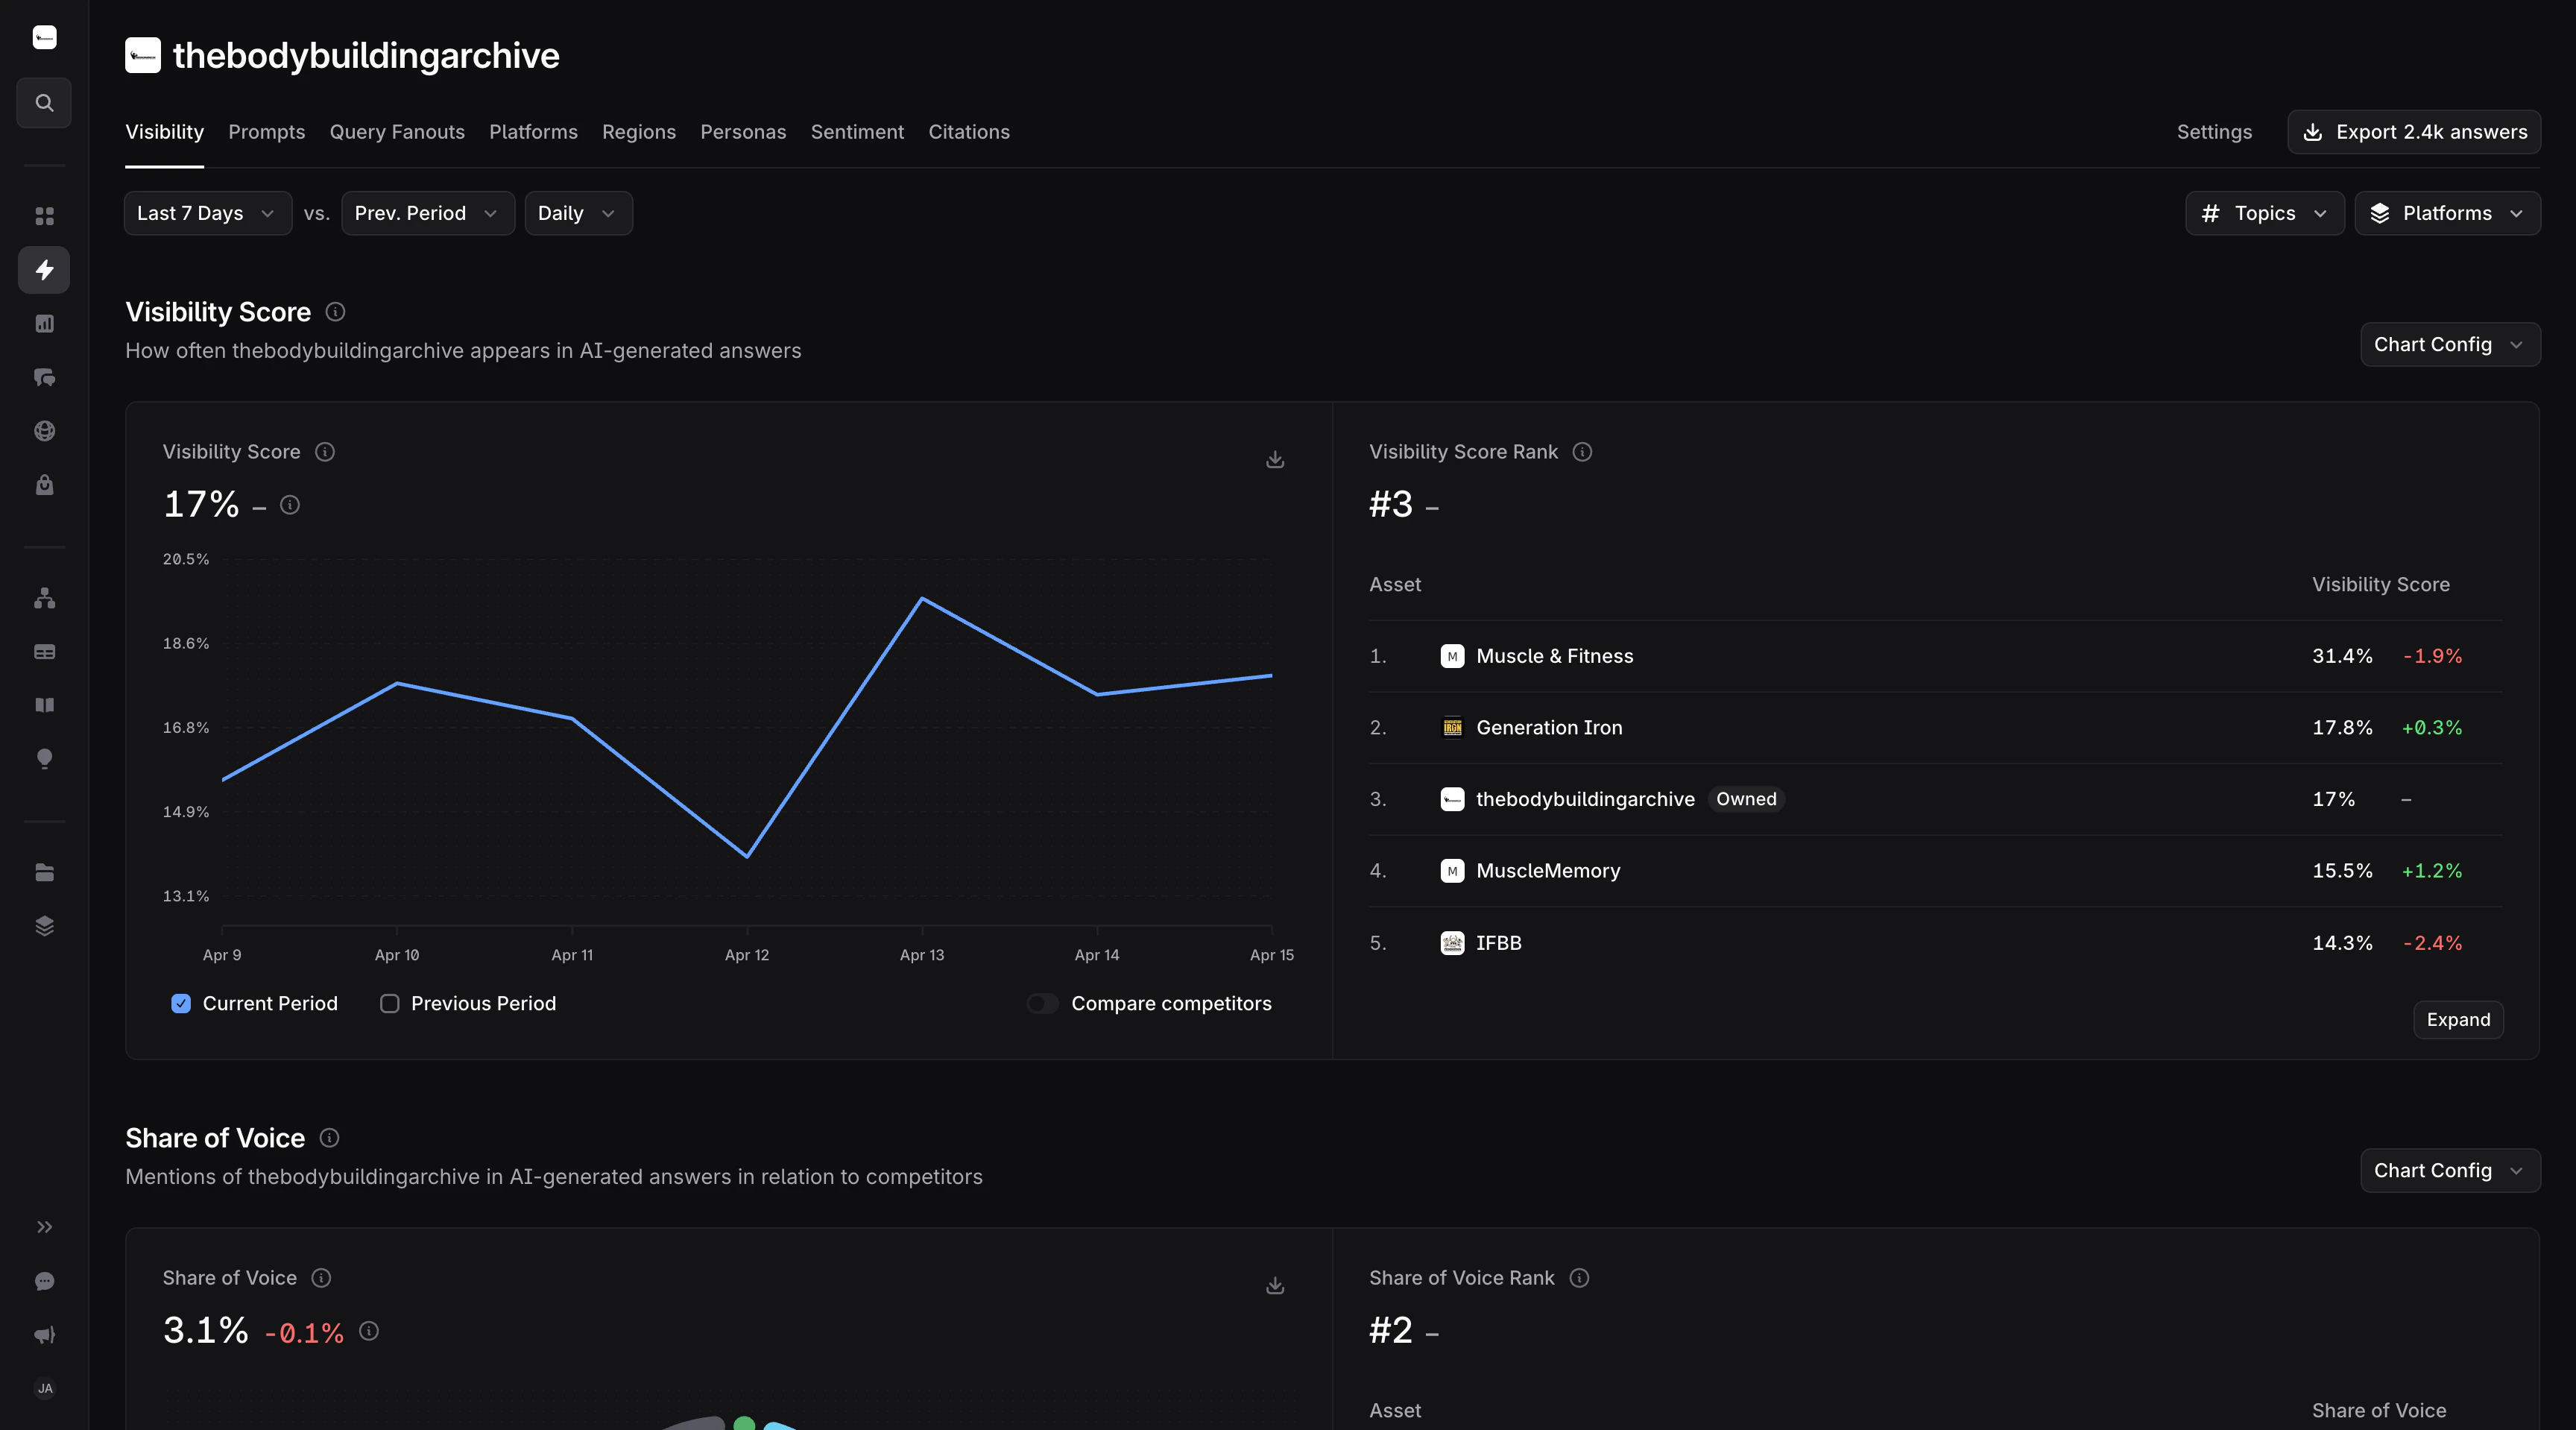 Track a specific company's visibility performance with daily granularity:
```http theme={null}
POST /v1/reports/visibility HTTP/1.1
Content-Type: application/json
X-API-Key: your_api_key
{
"category_id": "your_category_id",
"start_date": "2026-01-01",
"end_date": "2026-01-07",
"date_interval": "day",
"metrics": ["visibility_score"],
"dimensions": ["date"],
"filters": [
{
"field": "asset_name",
"operator": "is",
"value": "your_company_name"
}
]
}
```
```json theme={null}
{
"info": {}, // removed for brevity
"data": [
{ "metrics": [0.45], "dimensions": ["2026-01-01"] },
{ "metrics": [0.48], "dimensions": ["2026-01-02"] },
{ "metrics": [0.52], "dimensions": ["2026-01-03"] },
{ "metrics": [0.51], "dimensions": ["2026-01-04"] },
{ "metrics": [0.55], "dimensions": ["2026-01-05"] },
{ "metrics": [0.58], "dimensions": ["2026-01-06"] },
{ "metrics": [0.60], "dimensions": ["2026-01-07"] }
]
}
```
**Use case:** Monitor daily performance changes and identify trends.
Get the top 5 companies with the highest visibility score in a category:
```http theme={null}
POST /v1/reports/visibility HTTP/1.1
Content-Type: application/json
X-API-Key: your_api_key
{
"category_id": "your_category_id",
"start_date": "2026-01-01",
"end_date": "2026-01-07",
"metrics": ["visibility_score"],
"dimensions": ["asset_name"],
"pagination": {
"limit": 5
}
}
```
```json theme={null}
{
"info": {}, // removed for brevity
"data": [
{ "metrics": [0.583], "dimensions": ["Company A"] },
{ "metrics": [0.343], "dimensions": ["Company B"] },
{ "metrics": [0.231], "dimensions": ["Company C"] },
{ "metrics": [0.216], "dimensions": ["Company D"] },
{ "metrics": [0.173], "dimensions": ["Company E"] }
]
}
```
**Use case:** Identify market leaders and benchmark against top performers.
Track a specific company's visibility performance with daily granularity:
```http theme={null}
POST /v1/reports/visibility HTTP/1.1
Content-Type: application/json
X-API-Key: your_api_key
{
"category_id": "your_category_id",
"start_date": "2026-01-01",
"end_date": "2026-01-07",
"date_interval": "day",
"metrics": ["visibility_score"],
"dimensions": ["date"],
"filters": [
{
"field": "asset_name",
"operator": "is",
"value": "your_company_name"
}
]
}
```
```json theme={null}
{
"info": {}, // removed for brevity
"data": [
{ "metrics": [0.45], "dimensions": ["2026-01-01"] },
{ "metrics": [0.48], "dimensions": ["2026-01-02"] },
{ "metrics": [0.52], "dimensions": ["2026-01-03"] },
{ "metrics": [0.51], "dimensions": ["2026-01-04"] },
{ "metrics": [0.55], "dimensions": ["2026-01-05"] },
{ "metrics": [0.58], "dimensions": ["2026-01-06"] },
{ "metrics": [0.60], "dimensions": ["2026-01-07"] }
]
}
```
**Use case:** Monitor daily performance changes and identify trends.
Get the top 5 companies with the highest visibility score in a category:
```http theme={null}
POST /v1/reports/visibility HTTP/1.1
Content-Type: application/json
X-API-Key: your_api_key
{
"category_id": "your_category_id",
"start_date": "2026-01-01",
"end_date": "2026-01-07",
"metrics": ["visibility_score"],
"dimensions": ["asset_name"],
"pagination": {
"limit": 5
}
}
```
```json theme={null}
{
"info": {}, // removed for brevity
"data": [
{ "metrics": [0.583], "dimensions": ["Company A"] },
{ "metrics": [0.343], "dimensions": ["Company B"] },
{ "metrics": [0.231], "dimensions": ["Company C"] },
{ "metrics": [0.216], "dimensions": ["Company D"] },
{ "metrics": [0.173], "dimensions": ["Company E"] }
]
}
```
**Use case:** Identify market leaders and benchmark against top performers.
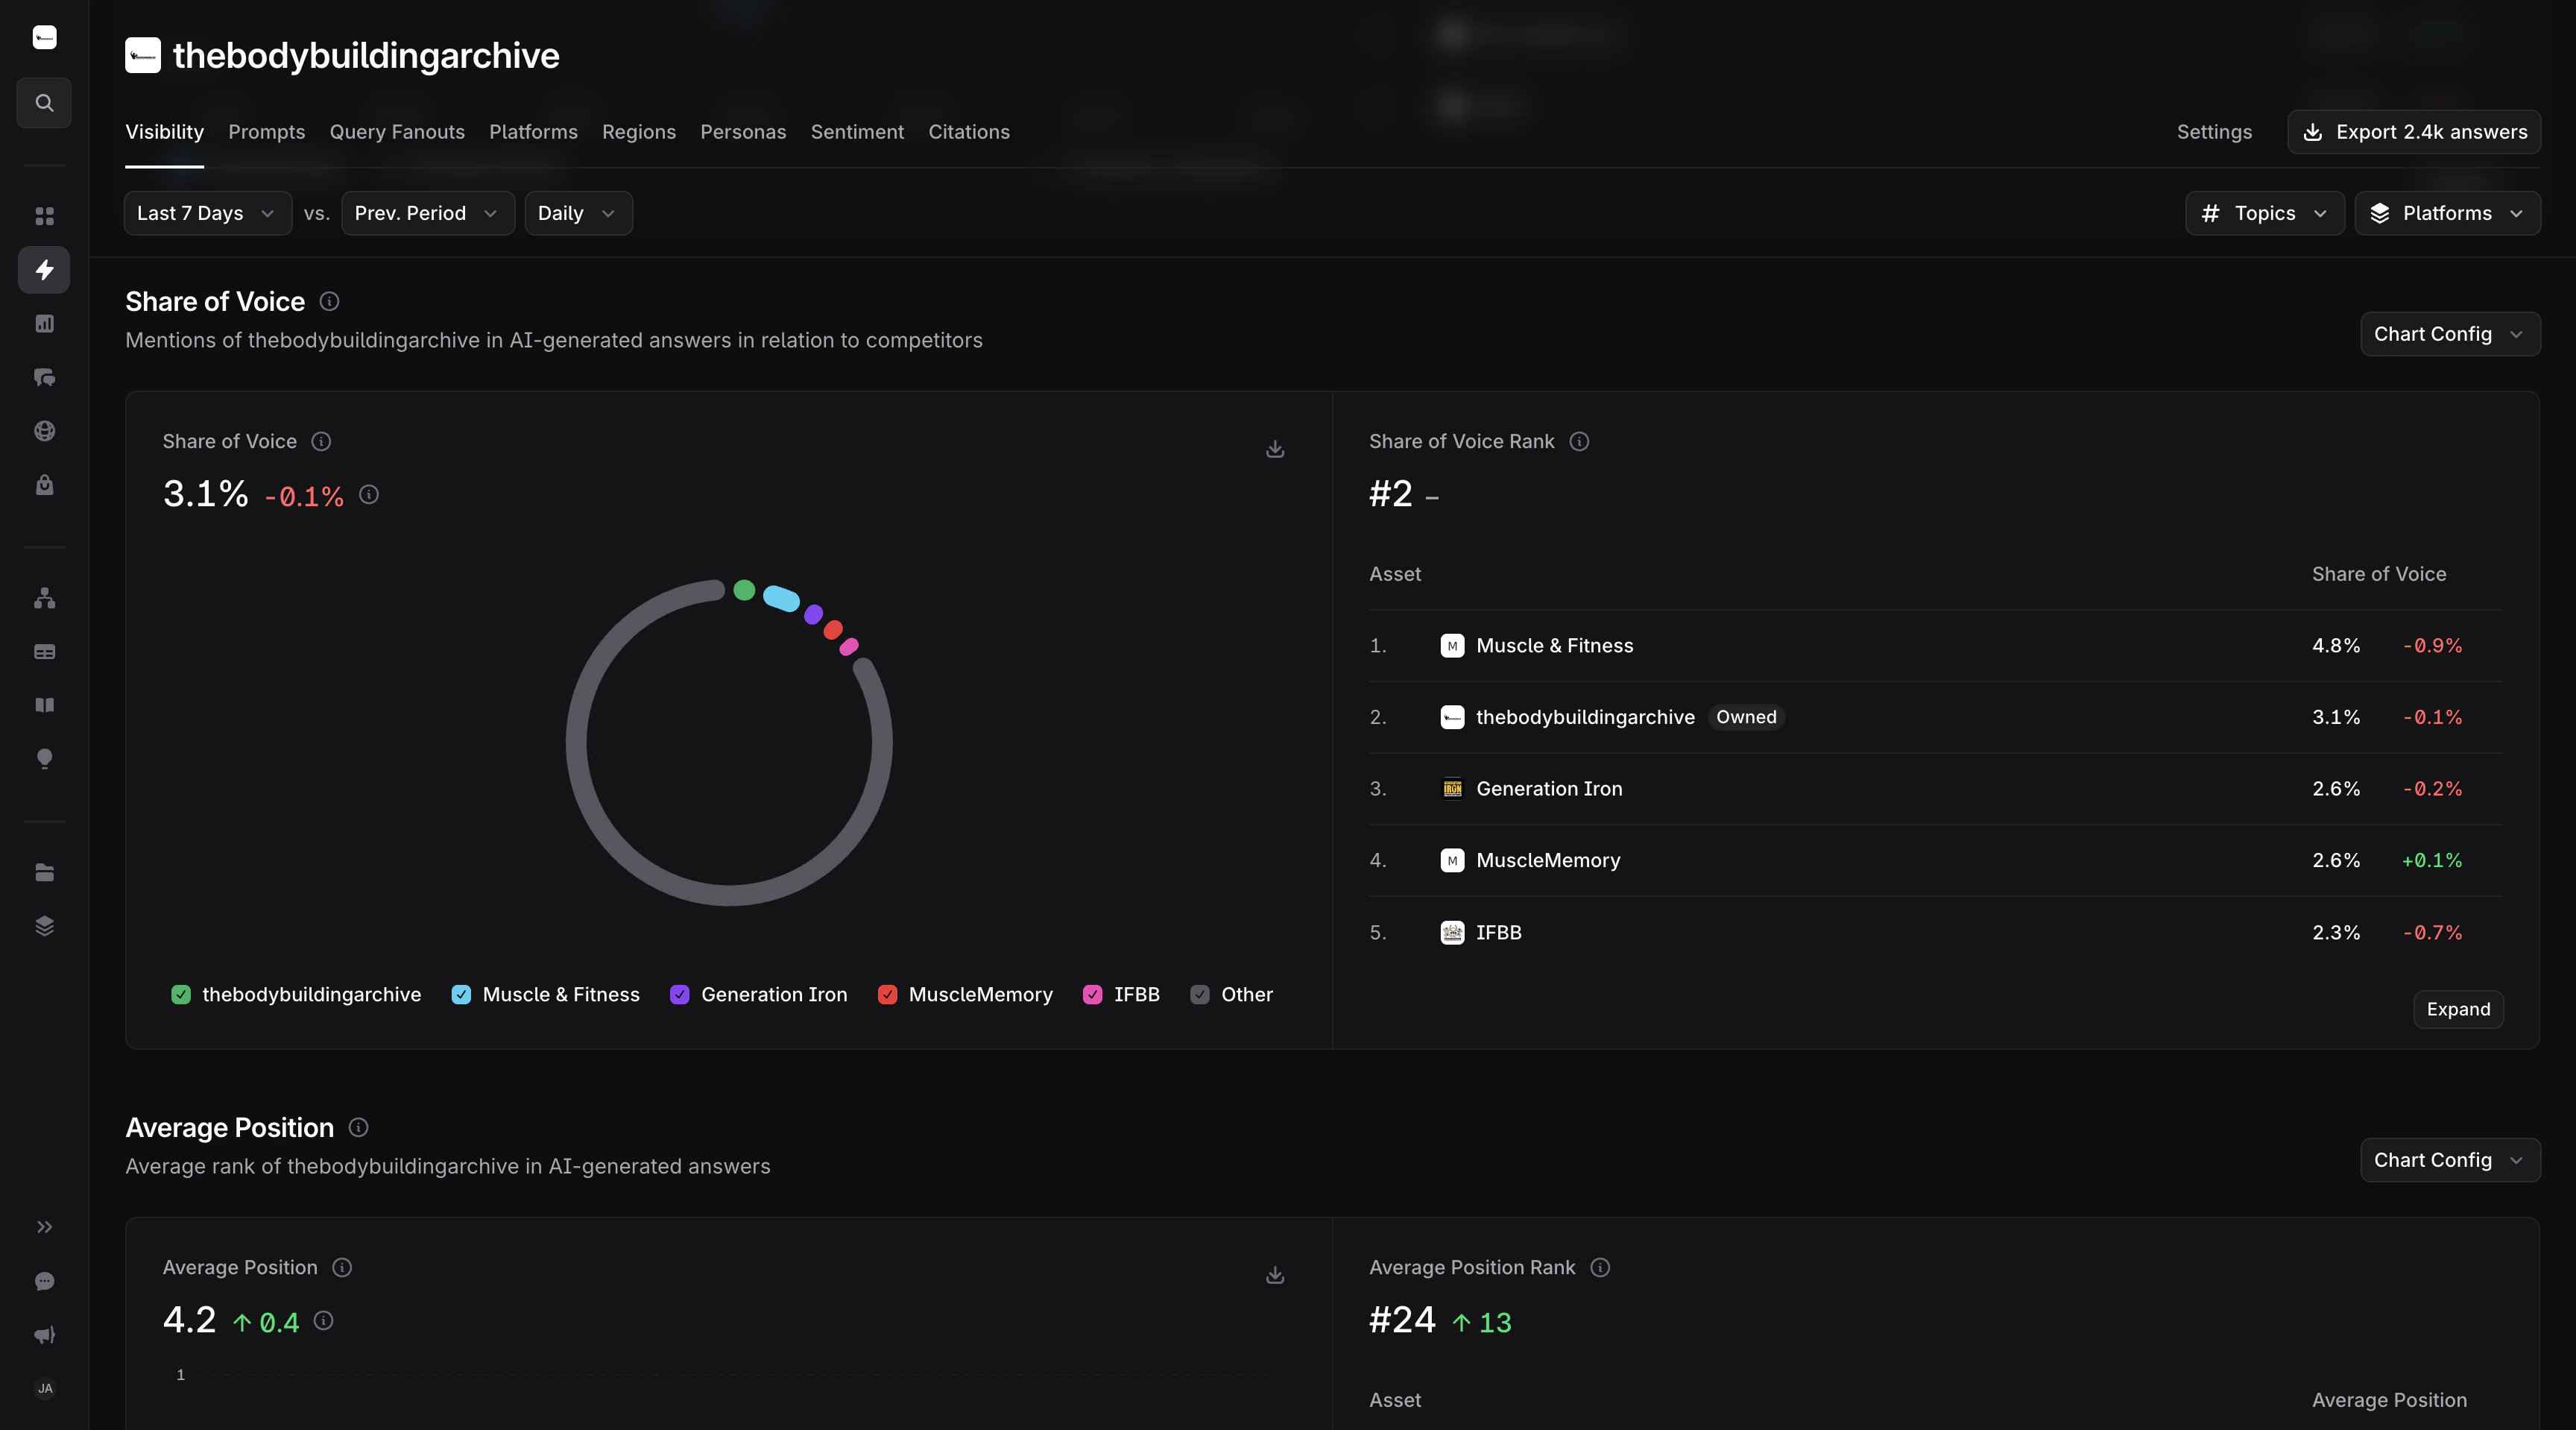 Analyze visibility score and share of voice across different platforms for a specific company:
```http theme={null}
POST /v1/reports/visibility HTTP/1.1
Content-Type: application/json
X-API-Key: your_api_key
{
"category_id": "your_category_id",
"start_date": "2026-01-01",
"end_date": "2026-01-07",
"metrics": ["visibility_score", "share_of_voice"],
"dimensions": ["model"],
"filters": [
{
"field": "asset_name",
"operator": "is",
"value": "your_company_name"
}
]
}
```
```json theme={null}
{
"info": {}, // removed for brevity
"data": [
{ "metrics": [0.72, 0.15], "dimensions": ["ChatGPT"] },
{ "metrics": [0.65, 0.12], "dimensions": ["Perplexity"] },
{ "metrics": [0.58, 0.09], "dimensions": ["Gemini"] },
{ "metrics": [0.41, 0.06], "dimensions": ["Claude"] }
]
}
```
**Use case:** Understand platform-specific performance and opportunities.
Analyze visibility score and share of voice across different regions for a specific company:
```http theme={null}
POST /v1/reports/visibility HTTP/1.1
Content-Type: application/json
X-API-Key: your_api_key
{
"category_id": "your_category_id",
"start_date": "2026-01-01",
"end_date": "2026-01-07",
"metrics": ["visibility_score", "share_of_voice"],
"dimensions": ["region"],
"filters": [
{
"field": "asset_name",
"operator": "is",
"value": "your_company_name"
}
]
}
```
```json theme={null}
{
"info": {}, // removed for brevity
"data": [
{
"metrics": [0.85, 0.32],
"dimensions": ["North America"]
},
{
"metrics": [0.72, 0.28],
"dimensions": ["Europe"]
}
]
}
```
**Use case:** Identify regional strengths and weaknesses in visibility score and share of voice.
Analyze visibility score and share of voice across different platforms for a specific company:
```http theme={null}
POST /v1/reports/visibility HTTP/1.1
Content-Type: application/json
X-API-Key: your_api_key
{
"category_id": "your_category_id",
"start_date": "2026-01-01",
"end_date": "2026-01-07",
"metrics": ["visibility_score", "share_of_voice"],
"dimensions": ["model"],
"filters": [
{
"field": "asset_name",
"operator": "is",
"value": "your_company_name"
}
]
}
```
```json theme={null}
{
"info": {}, // removed for brevity
"data": [
{ "metrics": [0.72, 0.15], "dimensions": ["ChatGPT"] },
{ "metrics": [0.65, 0.12], "dimensions": ["Perplexity"] },
{ "metrics": [0.58, 0.09], "dimensions": ["Gemini"] },
{ "metrics": [0.41, 0.06], "dimensions": ["Claude"] }
]
}
```
**Use case:** Understand platform-specific performance and opportunities.
Analyze visibility score and share of voice across different regions for a specific company:
```http theme={null}
POST /v1/reports/visibility HTTP/1.1
Content-Type: application/json
X-API-Key: your_api_key
{
"category_id": "your_category_id",
"start_date": "2026-01-01",
"end_date": "2026-01-07",
"metrics": ["visibility_score", "share_of_voice"],
"dimensions": ["region"],
"filters": [
{
"field": "asset_name",
"operator": "is",
"value": "your_company_name"
}
]
}
```
```json theme={null}
{
"info": {}, // removed for brevity
"data": [
{
"metrics": [0.85, 0.32],
"dimensions": ["North America"]
},
{
"metrics": [0.72, 0.28],
"dimensions": ["Europe"]
}
]
}
```
**Use case:** Identify regional strengths and weaknesses in visibility score and share of voice.
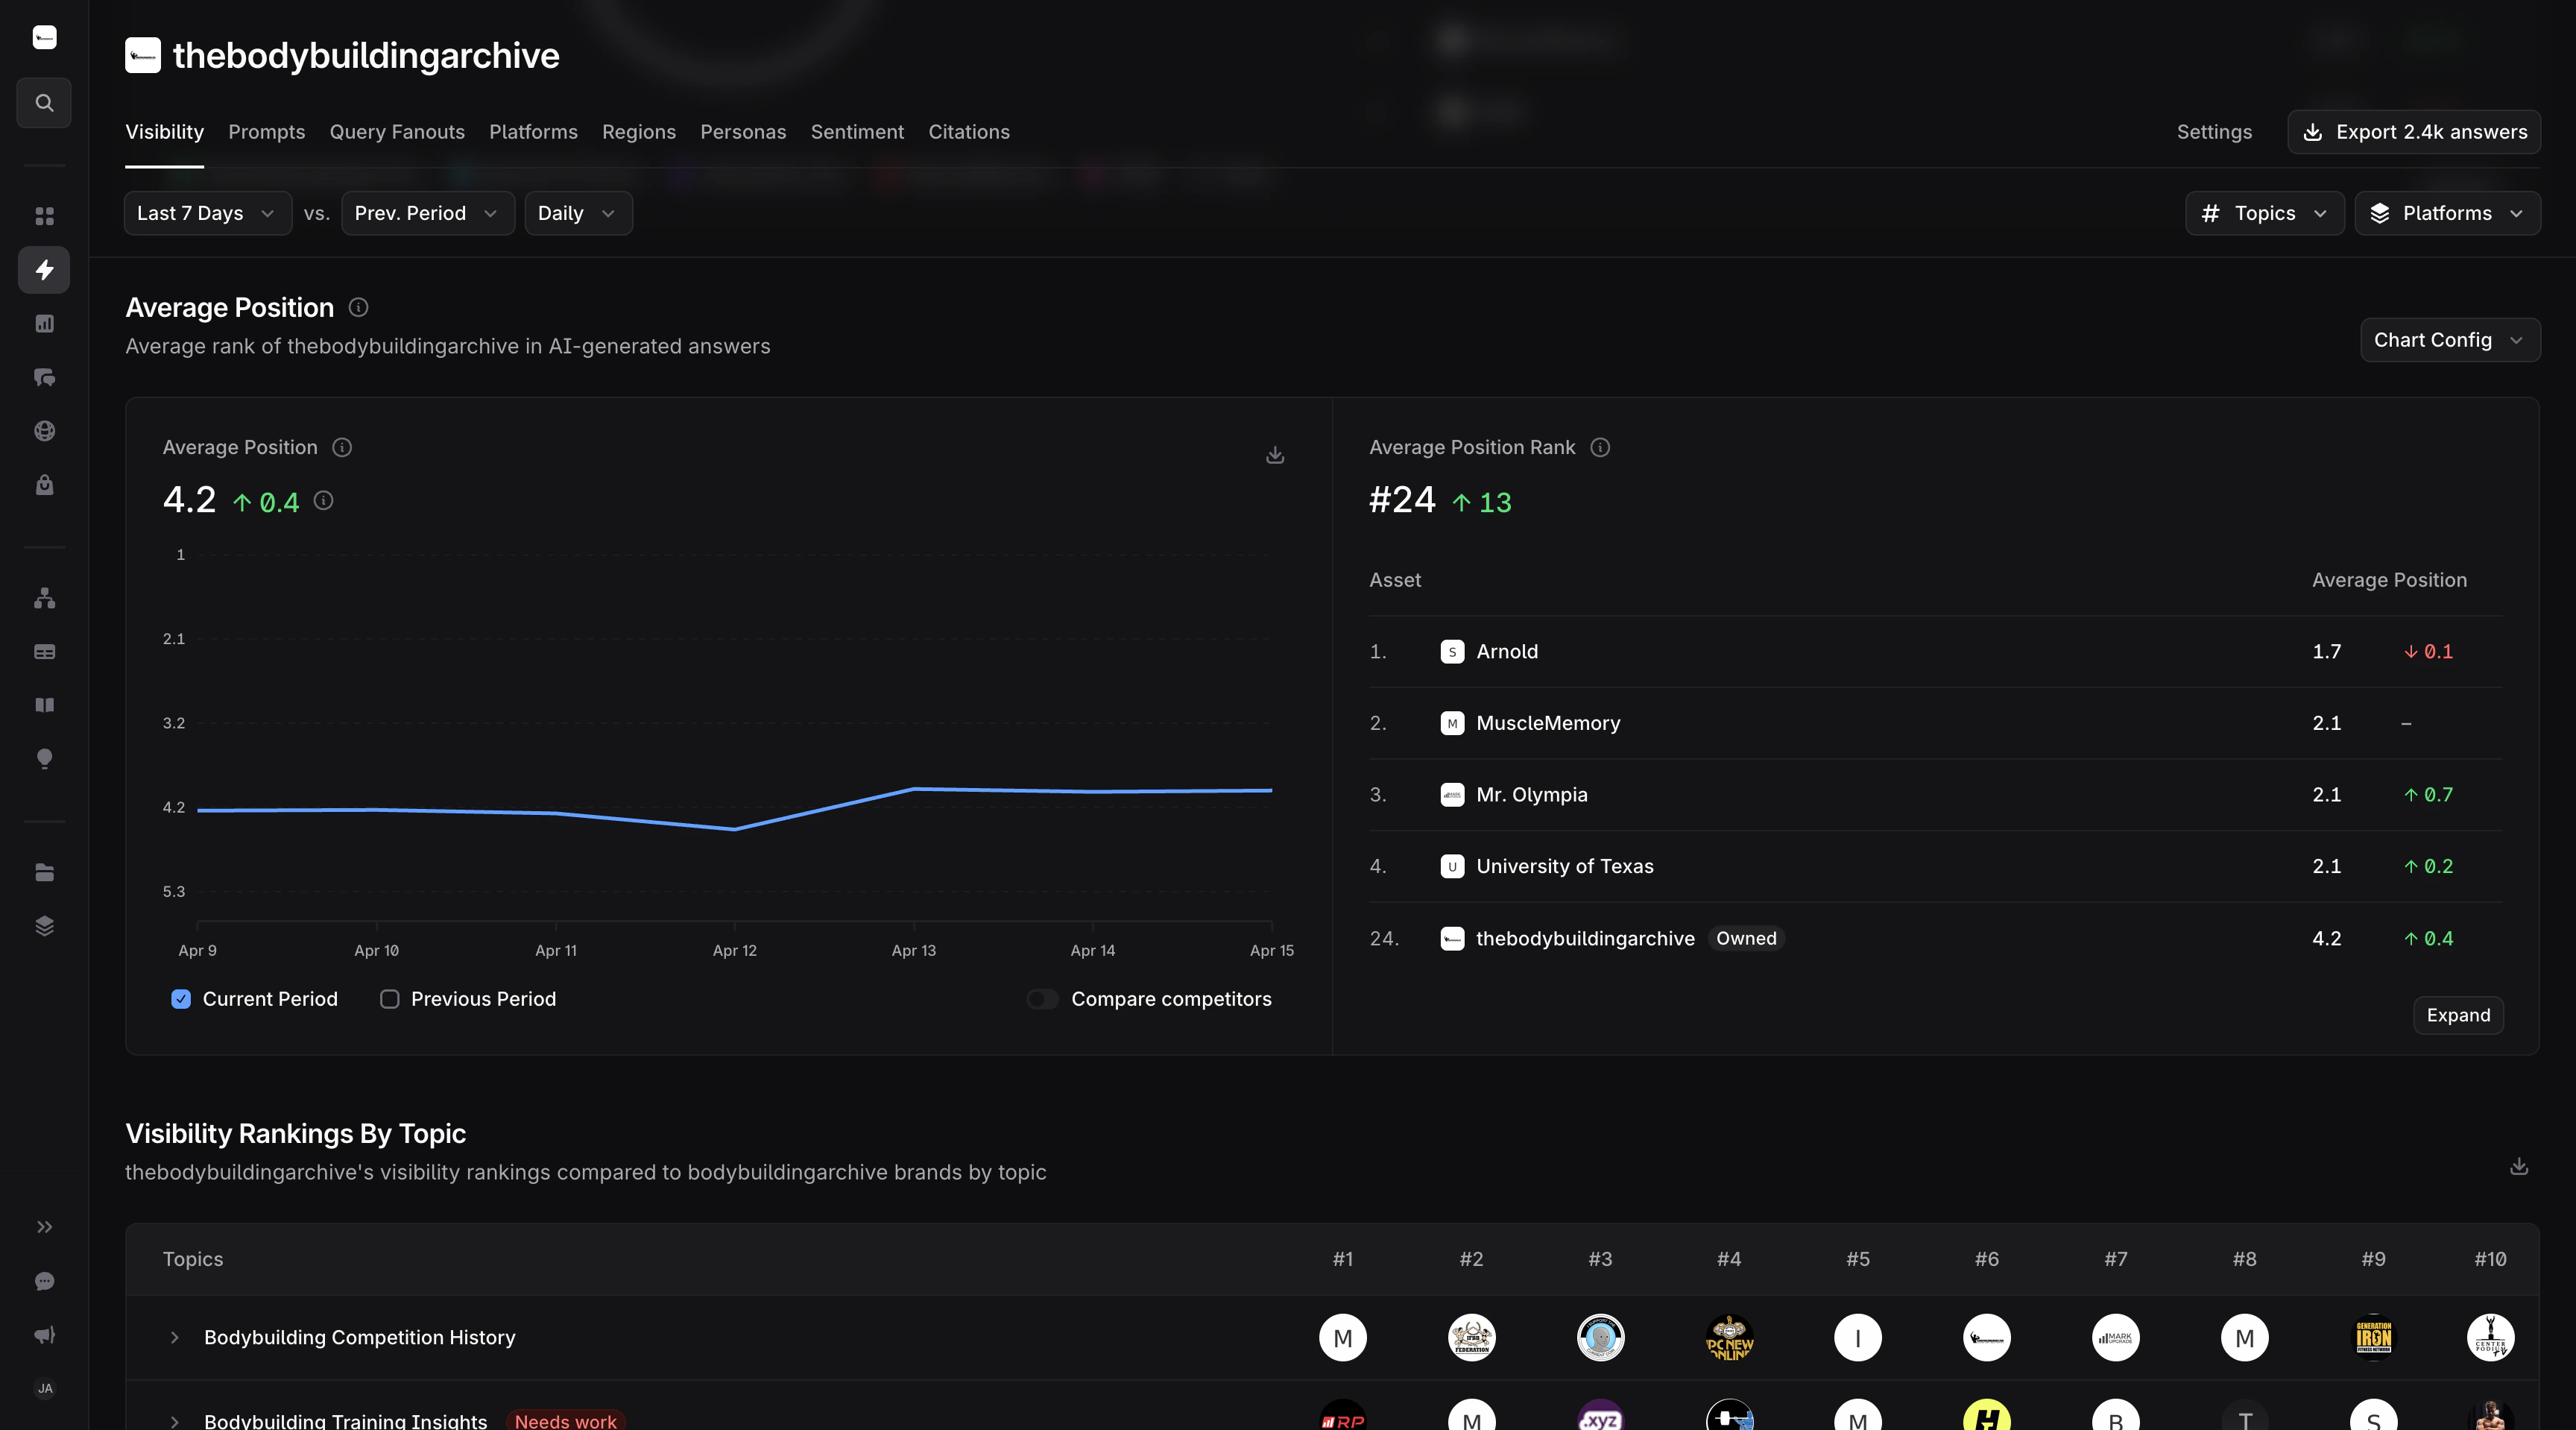 To replicate the Average Position view in the platform, two API calls are needed. The platform shows average position for the top assets ranked by visibility — not all assets sorted by position.
**Step 1:** Get the top assets by visibility score:
```http theme={null}
POST /v1/reports/visibility HTTP/1.1
Content-Type: application/json
X-API-Key: your_api_key
{
"category_id": "your_category_id",
"start_date": "2026-01-01",
"end_date": "2026-01-07",
"metrics": ["visibility_score"],
"dimensions": ["asset_name"],
"order_by": { "visibility_score": "desc" },
"pagination": { "limit": 50 }
}
```
**Step 2:** Use those asset names to get their average position:
```http theme={null}
POST /v1/reports/visibility HTTP/1.1
Content-Type: application/json
X-API-Key: your_api_key
{
"category_id": "your_category_id",
"start_date": "2026-01-01",
"end_date": "2026-01-07",
"metrics": ["average_position"],
"dimensions": ["asset_name"],
"filters": [
{
"field": "asset_name",
"operator": "in",
"value": ["Company A", "Company B", "Company C", "Company D", "Company E"]
}
],
"order_by": { "average_position": "asc" }
}
```
`"asc"` ordering — lower position is better, so #1 rank has the lowest value. The `"in"` filter uses the asset names returned from Step 1.
```json theme={null}
{
"info": {}, // removed for brevity
"data": [
{ "metrics": [1.6], "dimensions": ["Company A"] },
{ "metrics": [2.0], "dimensions": ["Company B"] },
{ "metrics": [2.2], "dimensions": ["Company C"] },
{ "metrics": [3.2], "dimensions": ["Company D"] },
{ "metrics": [3.5], "dimensions": ["Company E"] }
]
}
```
**Use case:** Identify top-ranked companies and benchmark against competitors.
Track a specific company's average position with daily granularity:
```http theme={null}
POST /v1/reports/visibility HTTP/1.1
Content-Type: application/json
X-API-Key: your_api_key
{
"category_id": "your_category_id",
"start_date": "2026-01-01",
"end_date": "2026-01-07",
"date_interval": "day",
"metrics": ["average_position"],
"dimensions": ["date"],
"filters": [
{
"field": "asset_name",
"operator": "is",
"value": "your_company_name"
}
]
}
```
```json theme={null}
{
"info": {}, // removed for brevity
"data": [
{ "metrics": [2.5], "dimensions": ["2026-01-01"] },
{ "metrics": [2.3], "dimensions": ["2026-01-02"] },
{ "metrics": [2.1], "dimensions": ["2026-01-03"] },
{ "metrics": [2.0], "dimensions": ["2026-01-04"] },
{ "metrics": [2.2], "dimensions": ["2026-01-05"] },
{ "metrics": [2.4], "dimensions": ["2026-01-06"] },
{ "metrics": [2.2], "dimensions": ["2026-01-07"] }
]
}
```
**Use case:** Monitor daily ranking changes and identify trends.
To replicate the Average Position view in the platform, two API calls are needed. The platform shows average position for the top assets ranked by visibility — not all assets sorted by position.
**Step 1:** Get the top assets by visibility score:
```http theme={null}
POST /v1/reports/visibility HTTP/1.1
Content-Type: application/json
X-API-Key: your_api_key
{
"category_id": "your_category_id",
"start_date": "2026-01-01",
"end_date": "2026-01-07",
"metrics": ["visibility_score"],
"dimensions": ["asset_name"],
"order_by": { "visibility_score": "desc" },
"pagination": { "limit": 50 }
}
```
**Step 2:** Use those asset names to get their average position:
```http theme={null}
POST /v1/reports/visibility HTTP/1.1
Content-Type: application/json
X-API-Key: your_api_key
{
"category_id": "your_category_id",
"start_date": "2026-01-01",
"end_date": "2026-01-07",
"metrics": ["average_position"],
"dimensions": ["asset_name"],
"filters": [
{
"field": "asset_name",
"operator": "in",
"value": ["Company A", "Company B", "Company C", "Company D", "Company E"]
}
],
"order_by": { "average_position": "asc" }
}
```
`"asc"` ordering — lower position is better, so #1 rank has the lowest value. The `"in"` filter uses the asset names returned from Step 1.
```json theme={null}
{
"info": {}, // removed for brevity
"data": [
{ "metrics": [1.6], "dimensions": ["Company A"] },
{ "metrics": [2.0], "dimensions": ["Company B"] },
{ "metrics": [2.2], "dimensions": ["Company C"] },
{ "metrics": [3.2], "dimensions": ["Company D"] },
{ "metrics": [3.5], "dimensions": ["Company E"] }
]
}
```
**Use case:** Identify top-ranked companies and benchmark against competitors.
Track a specific company's average position with daily granularity:
```http theme={null}
POST /v1/reports/visibility HTTP/1.1
Content-Type: application/json
X-API-Key: your_api_key
{
"category_id": "your_category_id",
"start_date": "2026-01-01",
"end_date": "2026-01-07",
"date_interval": "day",
"metrics": ["average_position"],
"dimensions": ["date"],
"filters": [
{
"field": "asset_name",
"operator": "is",
"value": "your_company_name"
}
]
}
```
```json theme={null}
{
"info": {}, // removed for brevity
"data": [
{ "metrics": [2.5], "dimensions": ["2026-01-01"] },
{ "metrics": [2.3], "dimensions": ["2026-01-02"] },
{ "metrics": [2.1], "dimensions": ["2026-01-03"] },
{ "metrics": [2.0], "dimensions": ["2026-01-04"] },
{ "metrics": [2.2], "dimensions": ["2026-01-05"] },
{ "metrics": [2.4], "dimensions": ["2026-01-06"] },
{ "metrics": [2.2], "dimensions": ["2026-01-07"] }
]
}
```
**Use case:** Monitor daily ranking changes and identify trends.
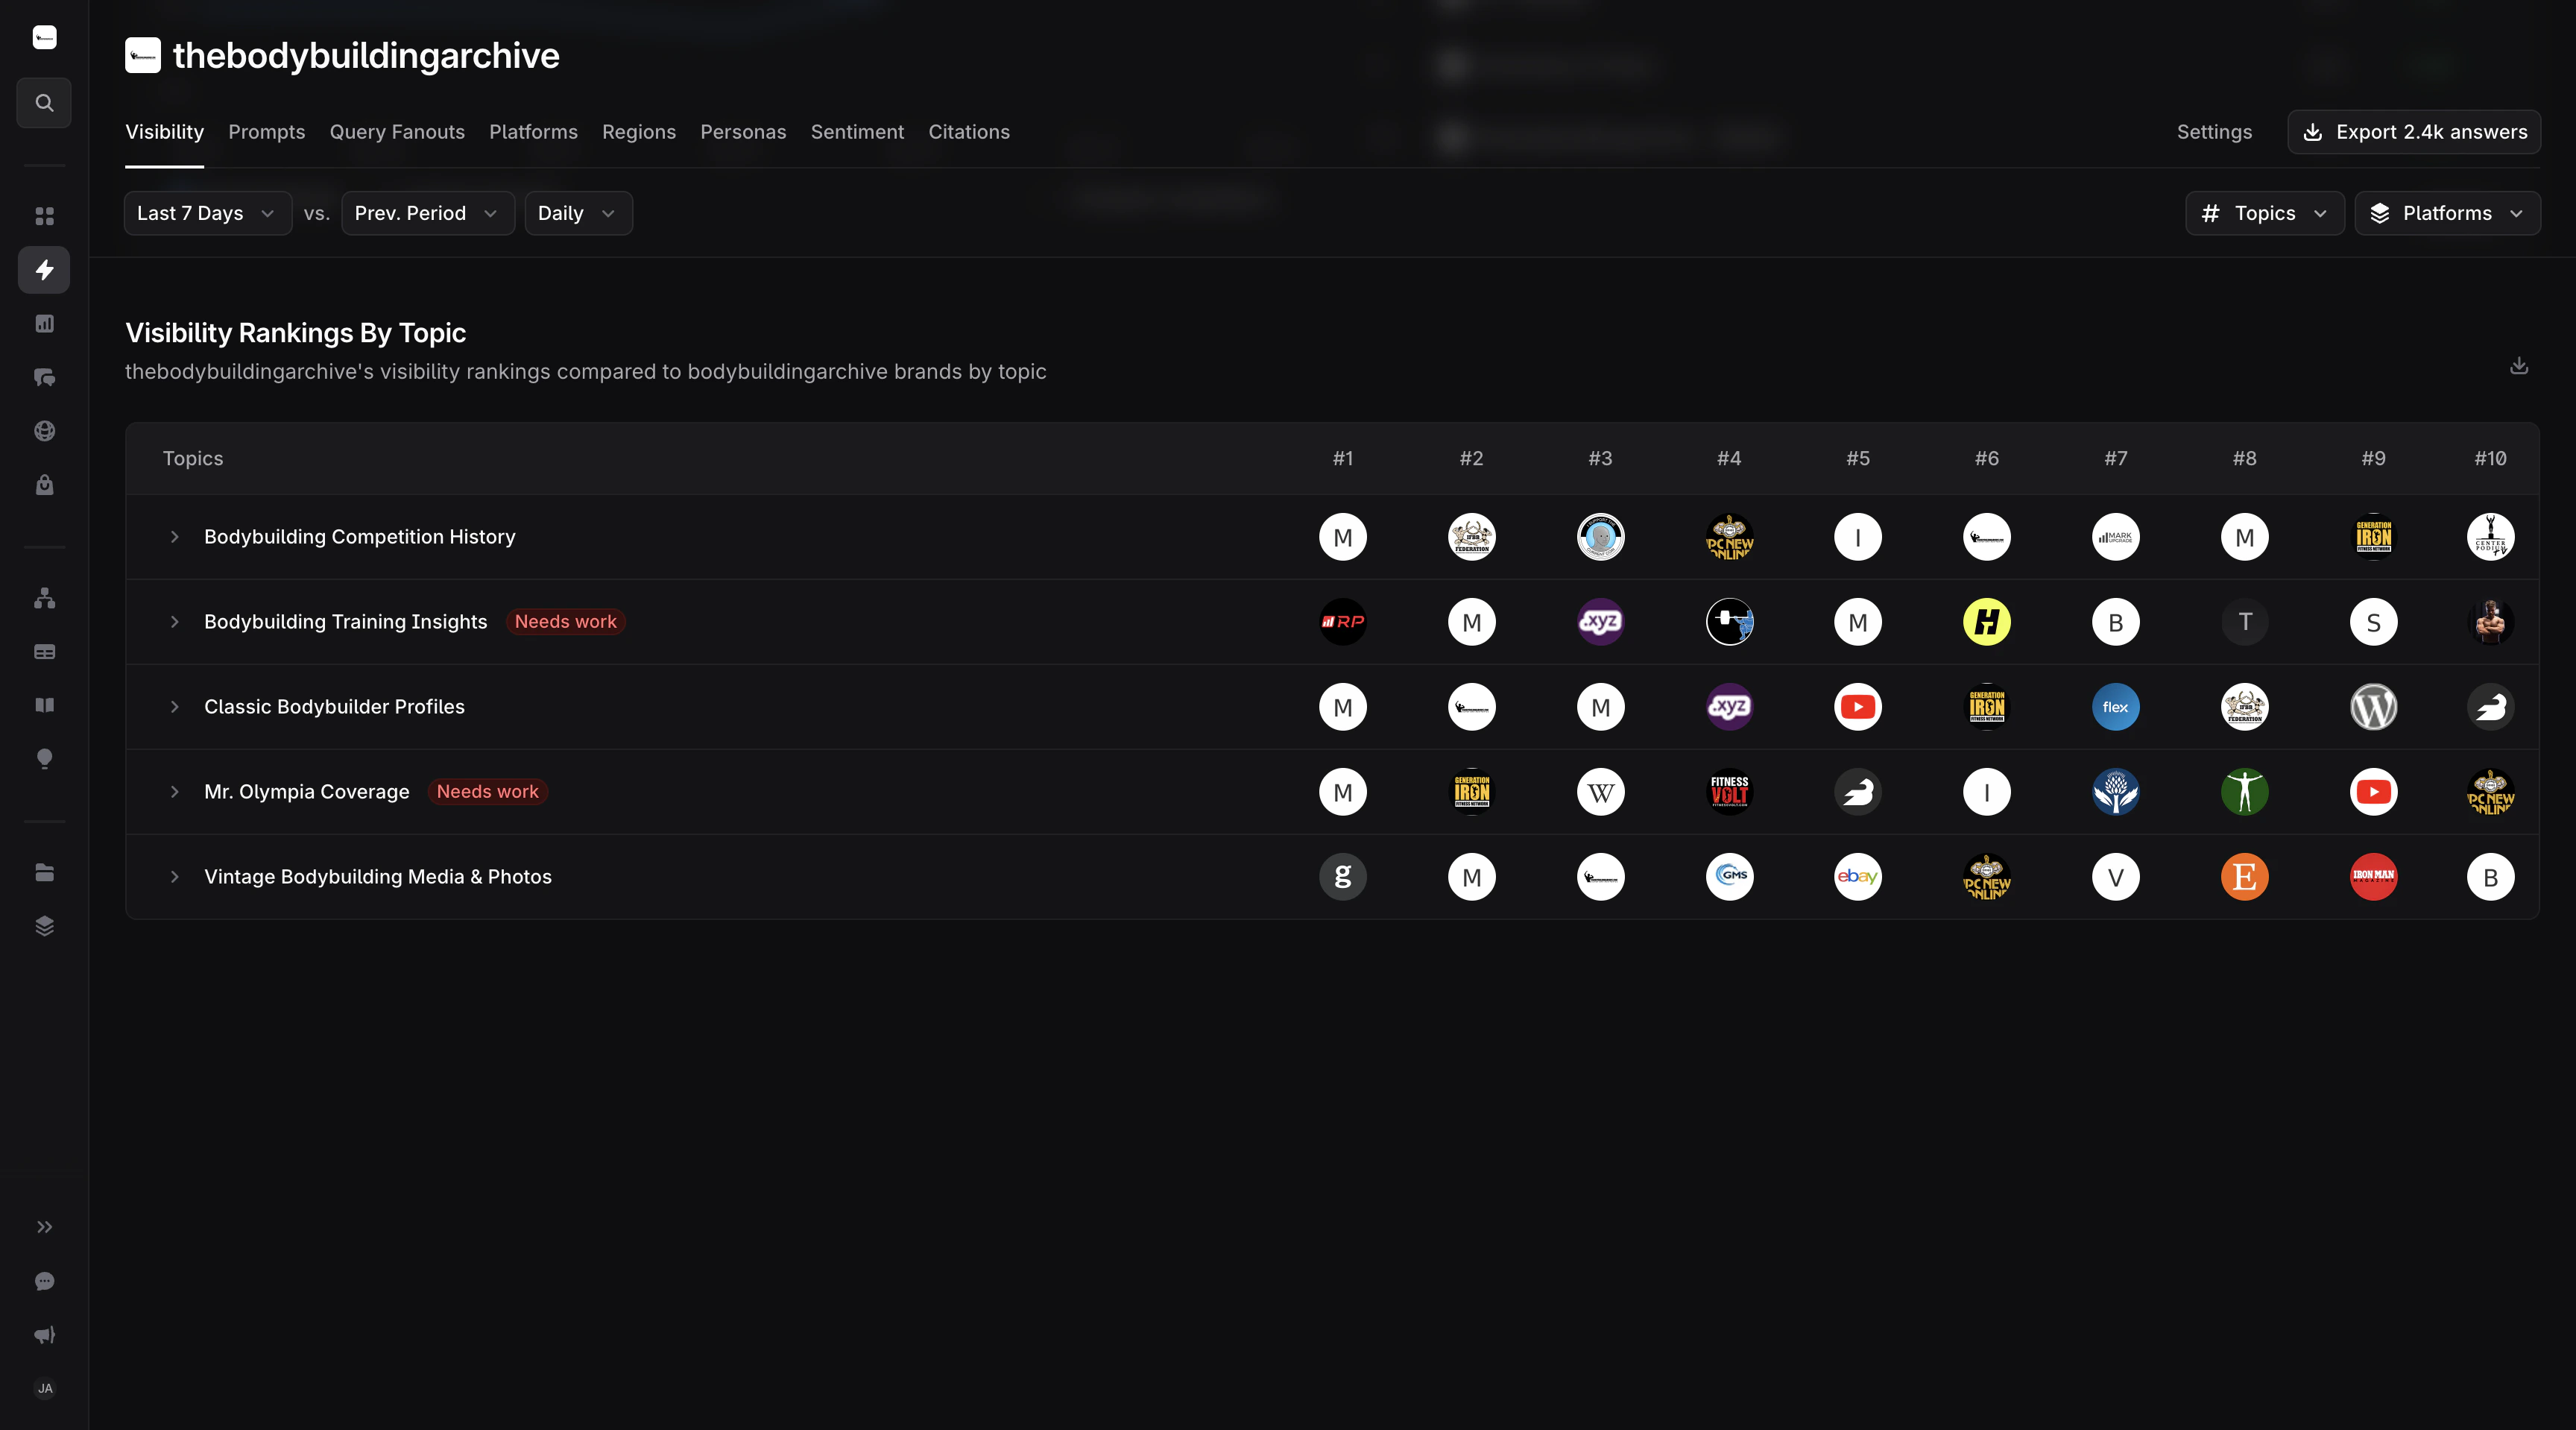 Analyze visibility score and share of voice across different topics and prompt types for a specific company:
```http theme={null}
POST /v1/reports/visibility HTTP/1.1
Content-Type: application/json
X-API-Key: your_api_key
{
"category_id": "your_category_id",
"start_date": "2026-01-01",
"end_date": "2026-01-07",
"metrics": ["visibility_score", "share_of_voice"],
"dimensions": ["prompt", "topic"],
"filters": [
{
"field": "asset_name",
"operator": "is",
"value": "your_company_name"
}
]
}
```
```json theme={null}
{
"info": {}, // removed for brevity
"data": [
{
"metrics": [0.45, 0.88],
"dimensions": ["What is the best CRM software?", "CRM Software"]
},
{
"metrics": [0.38, 0.75],
"dimensions": ["Top project management tools for teams", "Project Management"]
},
{
"metrics": [0.30, 0.62],
"dimensions": ["Best enterprise collaboration platforms", "Collaboration"]
}
]
}
```
**Use case:** Analyze visibility score and share of voice across different topics and prompt types for a specific company.
Combine multiple tag groups to slice a category by intersecting independent dimensions
Each filter in the `filters` array narrows the result. To express **OR within a group**, list values in a single `in` filter. To express **AND across groups**, send multiple `in` filters on the same field.
```http theme={null}
POST /v1/reports/visibility HTTP/1.1
Content-Type: application/json
X-API-Key: your_api_key
{
"category_id": "your_category_id",
"start_date": "2026-01-01",
"end_date": "2026-01-07",
"metrics": ["share_of_voice"],
"dimensions": ["asset_name"],
"filters": [
{
"field": "tag_id",
"operator": "in",
"value": [
"tag_id_product_a",
"tag_id_product_b",
"tag_id_product_c"
]
},
{
"field": "tag_id",
"operator": "in",
"value": ["tag_id_product_d"]
}
]
}
```
This matches prompts tagged with **at least one of** `product_a`, `product_b`, or `product_c` **and also** tagged `tag_id_product_d`. Equivalent boolean form: `(product_a OR product_b OR product_c) AND tag_id_product_d`.
A single `in` filter listing all four tag IDs would mean "any of these four":
`(product_a OR product_b OR product_c OR tag_id_product_d)`
## Sentiment Analysis
Analyze sentiment data and emotional responses across companies and topics. See the full [endpoint reference](/api-reference/reports/query-sentiment) for all available metrics, dimensions, and filters.
The same filter composition shown in [Mixed AND/OR Tag Filtering](#mixed-and%2For-tag-filtering) works on this endpoint.
Analyze visibility score and share of voice across different topics and prompt types for a specific company:
```http theme={null}
POST /v1/reports/visibility HTTP/1.1
Content-Type: application/json
X-API-Key: your_api_key
{
"category_id": "your_category_id",
"start_date": "2026-01-01",
"end_date": "2026-01-07",
"metrics": ["visibility_score", "share_of_voice"],
"dimensions": ["prompt", "topic"],
"filters": [
{
"field": "asset_name",
"operator": "is",
"value": "your_company_name"
}
]
}
```
```json theme={null}
{
"info": {}, // removed for brevity
"data": [
{
"metrics": [0.45, 0.88],
"dimensions": ["What is the best CRM software?", "CRM Software"]
},
{
"metrics": [0.38, 0.75],
"dimensions": ["Top project management tools for teams", "Project Management"]
},
{
"metrics": [0.30, 0.62],
"dimensions": ["Best enterprise collaboration platforms", "Collaboration"]
}
]
}
```
**Use case:** Analyze visibility score and share of voice across different topics and prompt types for a specific company.
Combine multiple tag groups to slice a category by intersecting independent dimensions
Each filter in the `filters` array narrows the result. To express **OR within a group**, list values in a single `in` filter. To express **AND across groups**, send multiple `in` filters on the same field.
```http theme={null}
POST /v1/reports/visibility HTTP/1.1
Content-Type: application/json
X-API-Key: your_api_key
{
"category_id": "your_category_id",
"start_date": "2026-01-01",
"end_date": "2026-01-07",
"metrics": ["share_of_voice"],
"dimensions": ["asset_name"],
"filters": [
{
"field": "tag_id",
"operator": "in",
"value": [
"tag_id_product_a",
"tag_id_product_b",
"tag_id_product_c"
]
},
{
"field": "tag_id",
"operator": "in",
"value": ["tag_id_product_d"]
}
]
}
```
This matches prompts tagged with **at least one of** `product_a`, `product_b`, or `product_c` **and also** tagged `tag_id_product_d`. Equivalent boolean form: `(product_a OR product_b OR product_c) AND tag_id_product_d`.
A single `in` filter listing all four tag IDs would mean "any of these four":
`(product_a OR product_b OR product_c OR tag_id_product_d)`
## Sentiment Analysis
Analyze sentiment data and emotional responses across companies and topics. See the full [endpoint reference](/api-reference/reports/query-sentiment) for all available metrics, dimensions, and filters.
The same filter composition shown in [Mixed AND/OR Tag Filtering](#mixed-and%2For-tag-filtering) works on this endpoint.
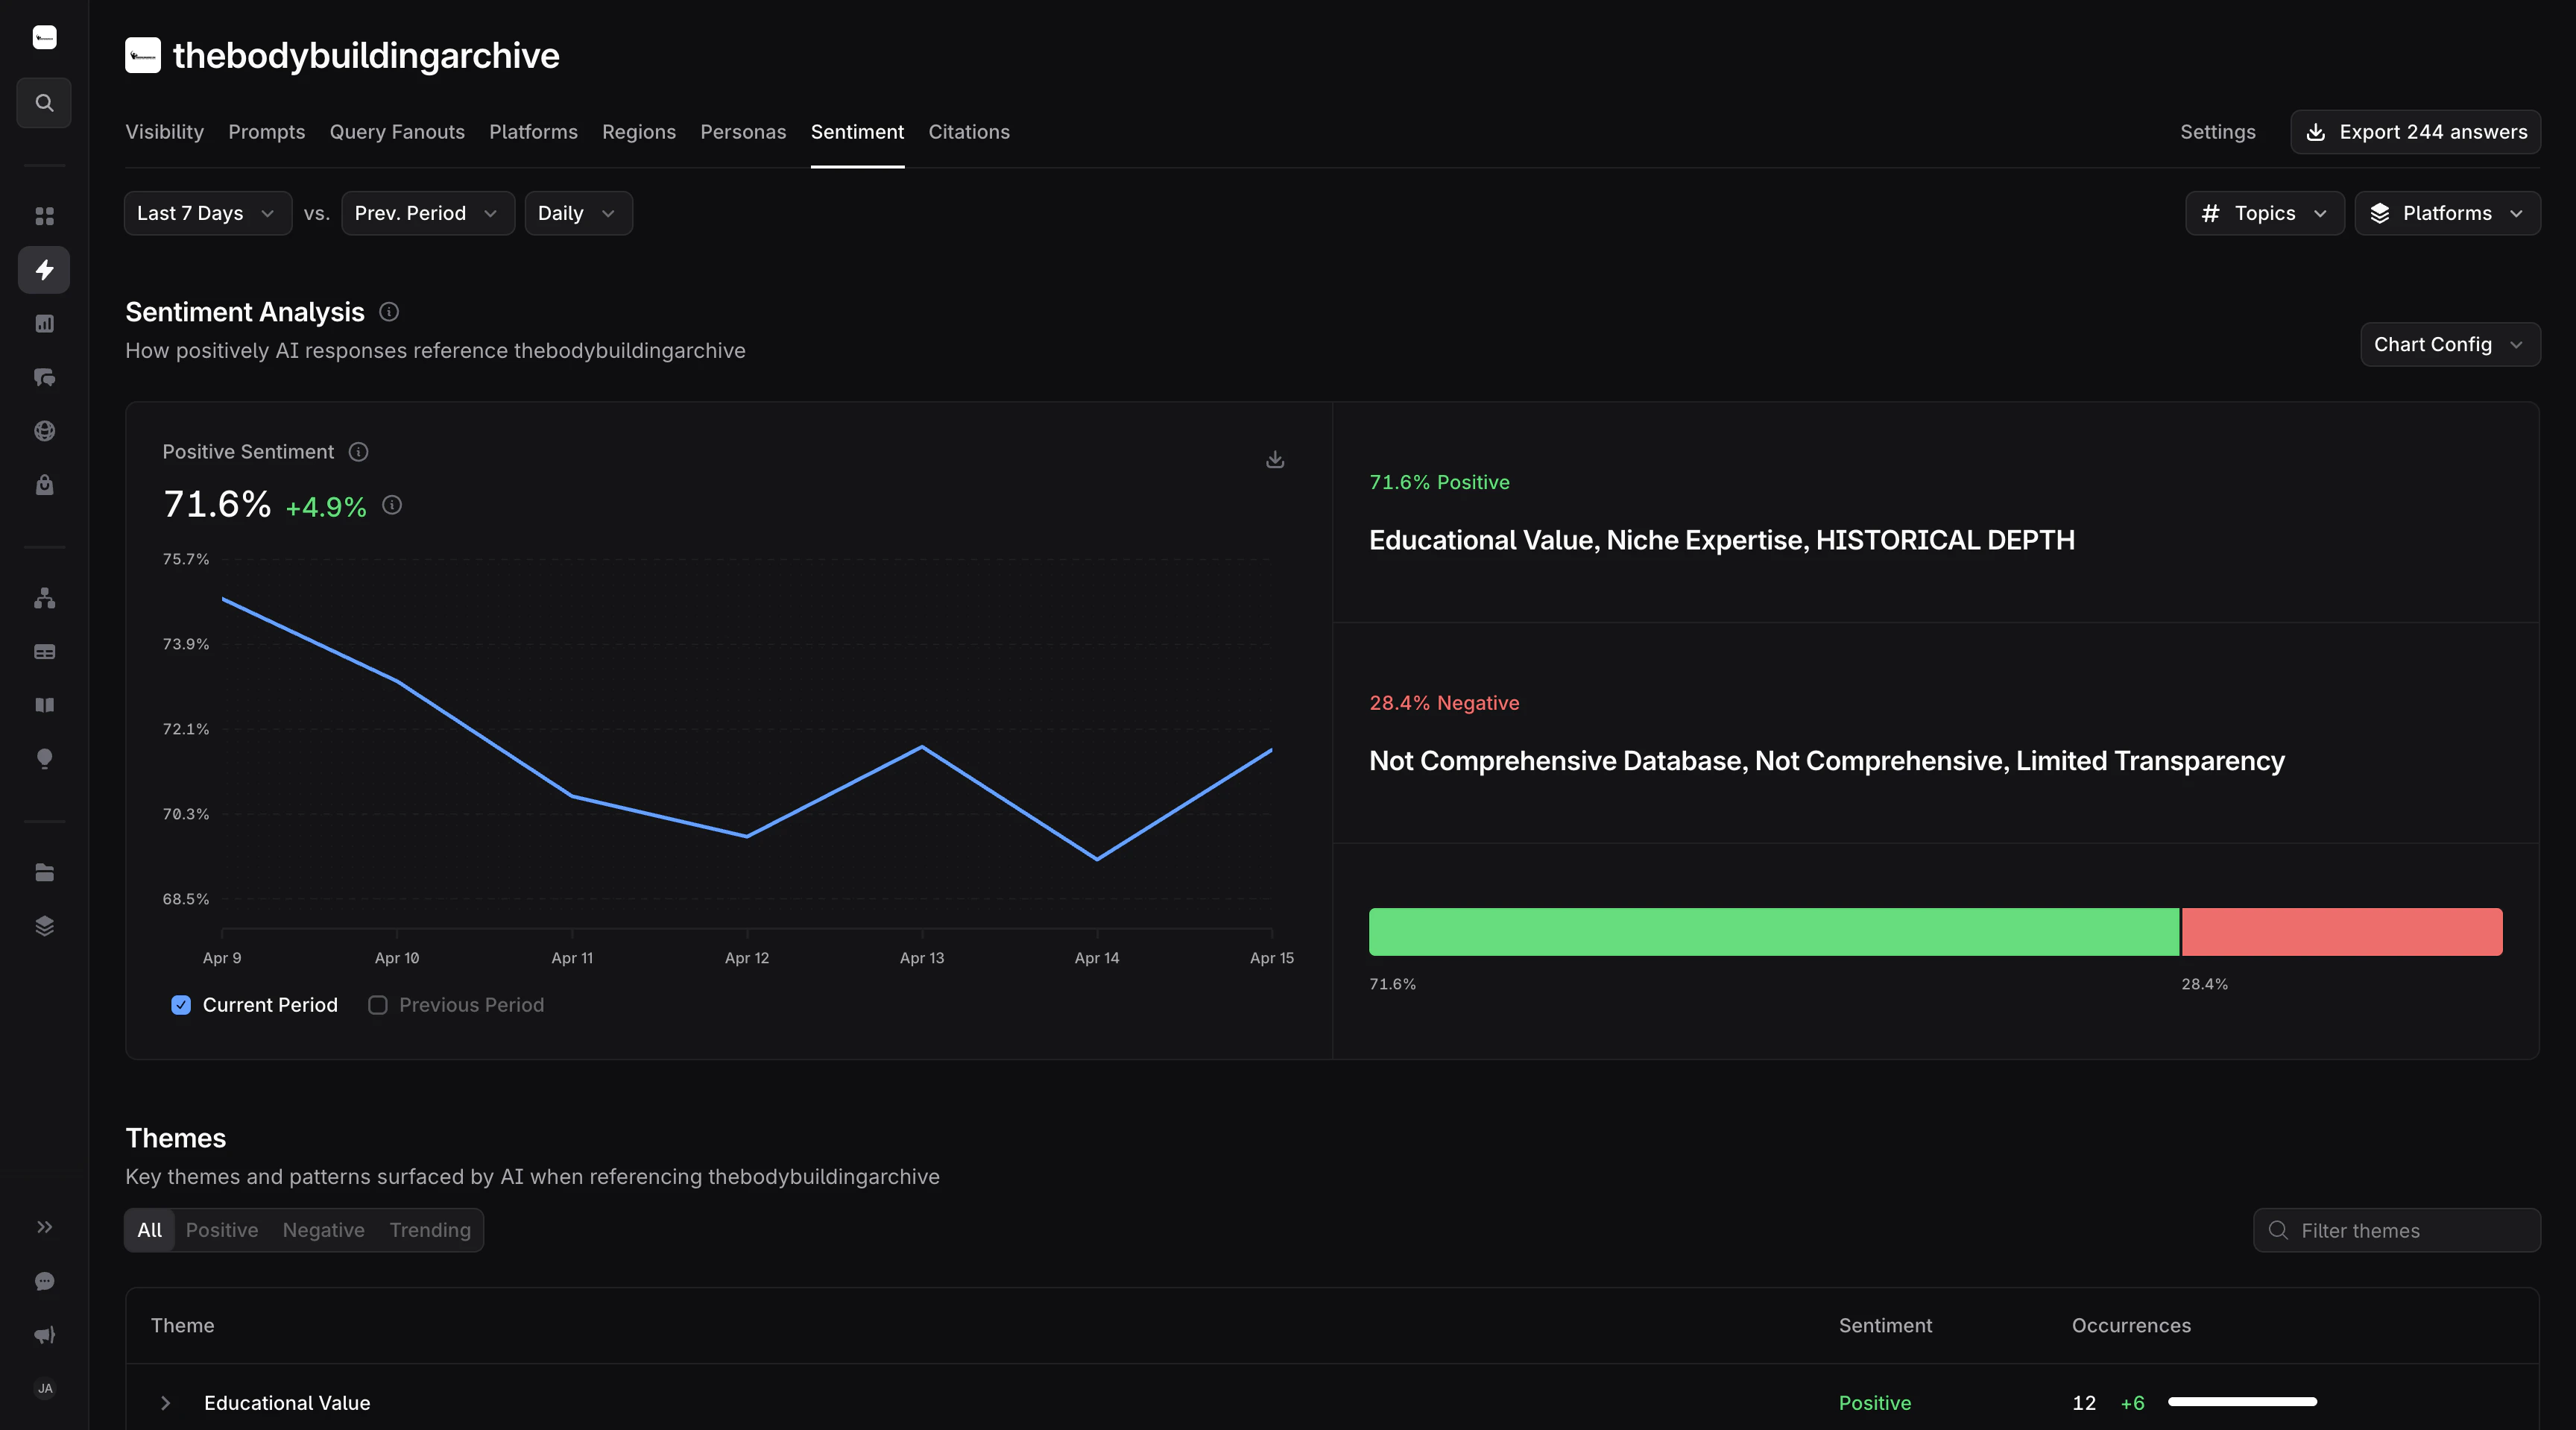 Identify companies with the most positive sentiment:
```http theme={null}
POST /v1/reports/sentiment HTTP/1.1
Content-Type: application/json
X-API-Key: your_api_key
{
"category_id": "your_category_id",
"start_date": "2026-01-01",
"end_date": "2026-01-07",
"metrics": ["positive"],
"dimensions": ["asset_name"],
"pagination": { "limit": 5 }
}
```
```json theme={null}
{
"info": {}, // removed for brevity
"data": [
{ "metrics": [2413], "dimensions": ["Company A"] },
{ "metrics": [1856], "dimensions": ["Company B"] },
{ "metrics": [1204], "dimensions": ["Company C"] },
{ "metrics": [987], "dimensions": ["Company D"] },
{ "metrics": [714], "dimensions": ["Company E"] }
]
}
```
Sentiment metrics are integer counts, not percentages like visibility. `positive` = count of positive sentiment instances for that asset.
Available sentiment metrics: `positive`, `negative`, `occurrences` (total count).
**Use case:** Understand which companies have the best reputation and sentiment.
Identify companies with the most positive sentiment:
```http theme={null}
POST /v1/reports/sentiment HTTP/1.1
Content-Type: application/json
X-API-Key: your_api_key
{
"category_id": "your_category_id",
"start_date": "2026-01-01",
"end_date": "2026-01-07",
"metrics": ["positive"],
"dimensions": ["asset_name"],
"pagination": { "limit": 5 }
}
```
```json theme={null}
{
"info": {}, // removed for brevity
"data": [
{ "metrics": [2413], "dimensions": ["Company A"] },
{ "metrics": [1856], "dimensions": ["Company B"] },
{ "metrics": [1204], "dimensions": ["Company C"] },
{ "metrics": [987], "dimensions": ["Company D"] },
{ "metrics": [714], "dimensions": ["Company E"] }
]
}
```
Sentiment metrics are integer counts, not percentages like visibility. `positive` = count of positive sentiment instances for that asset.
Available sentiment metrics: `positive`, `negative`, `occurrences` (total count).
**Use case:** Understand which companies have the best reputation and sentiment.
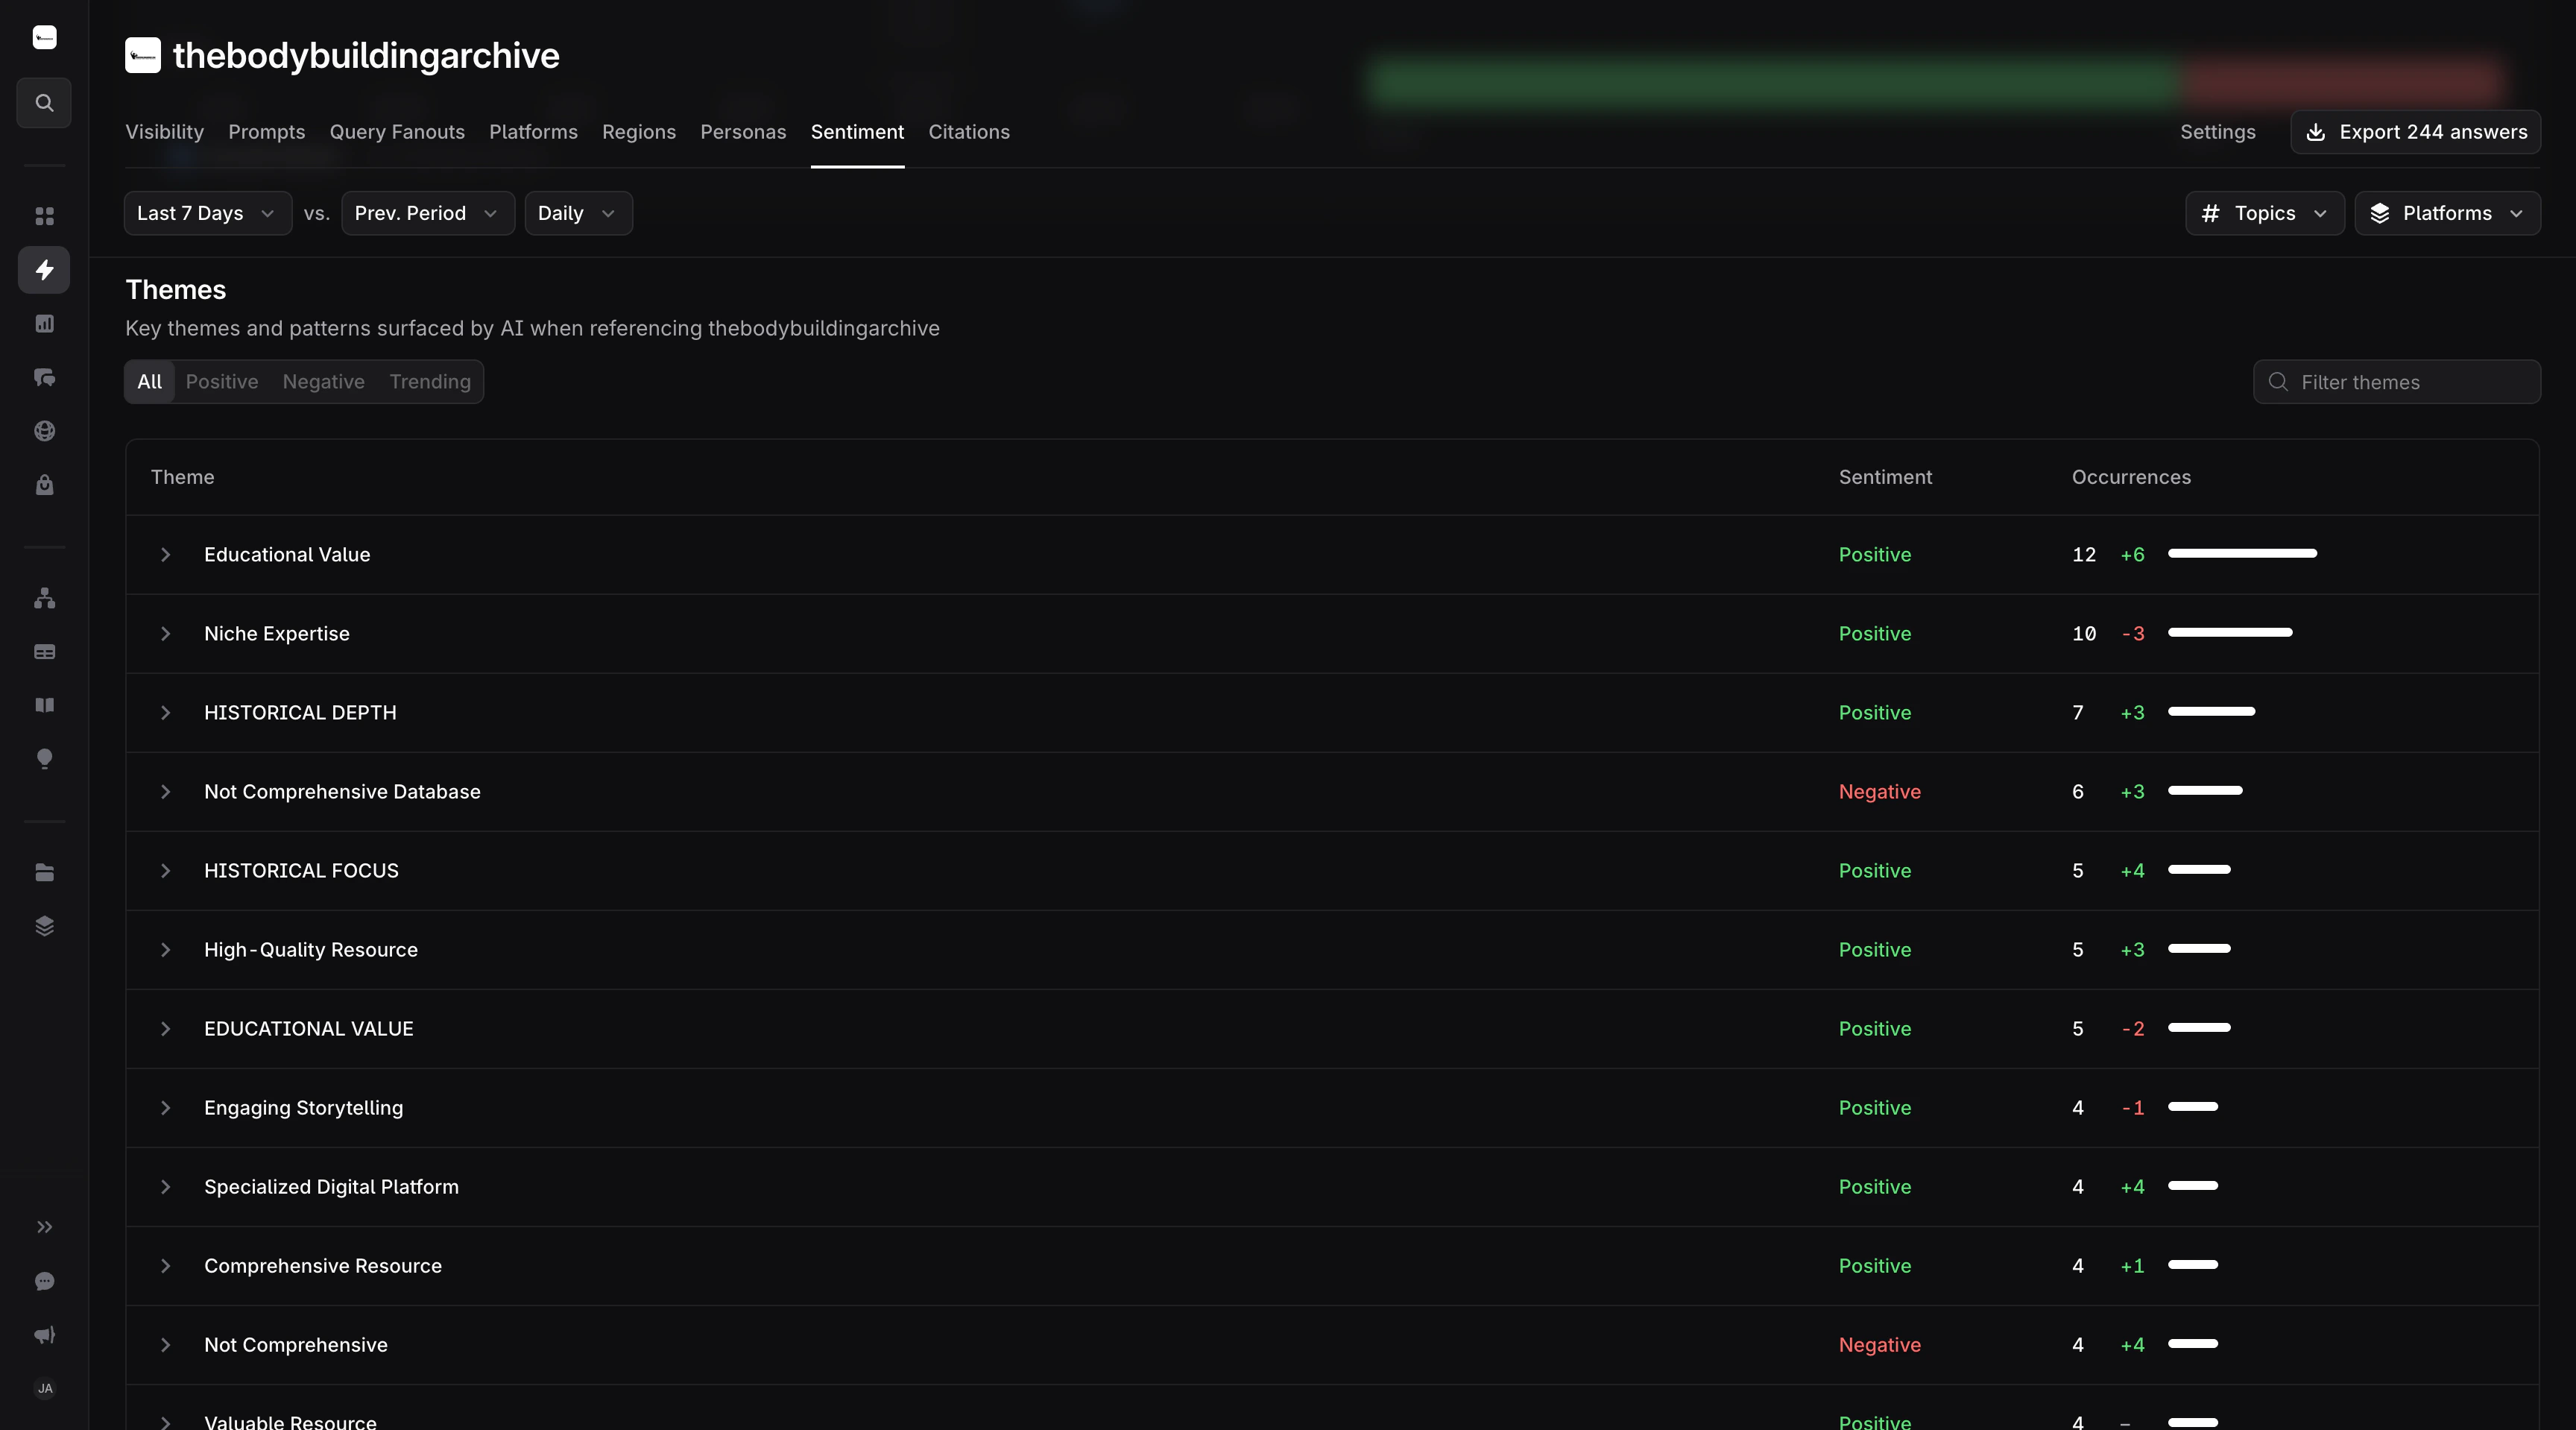 Analyze positive and negative sentiment across different themes for a specific company:
```http theme={null}
POST /v1/reports/sentiment HTTP/1.1
Content-Type: application/json
X-API-Key: your_api_key
{
"category_id": "your_category_id",
"start_date": "2026-01-01",
"end_date": "2026-01-07",
"metrics": ["positive", "negative"],
"dimensions": ["theme"],
"pagination": {
"limit": 5
},
"filters": [
{
"field": "asset_name",
"operator": "is",
"value": "your_company_name"
}
]
}
```
```json theme={null}
{
"info": {}, // removed for brevity
"data": [
{
"metrics": [12, 45],
"dimensions": ["Customer Support"]
},
{
"metrics": [8, 32],
"dimensions": ["Pricing"]
},
{
"metrics": [6, 28],
"dimensions": ["Ease of Use"]
},
{
"metrics": [4, 50],
"dimensions": ["Product Quality"]
},
{
"metrics": [2, 18],
"dimensions": ["Integration"]
}
]
}
```
**Use case:** Identify themes driving positive or negative sentiment for targeted improvements.
## Citation Reports
Track mentions, references, and citation patterns across domains and pages. See the full [endpoint reference](/api-reference/reports/query-citations) for all available metrics, dimensions, and filters.
The same filter composition shown in [Mixed AND/OR Tag Filtering](#mixed-and%2For-tag-filtering) works on this endpoint.
Analyze positive and negative sentiment across different themes for a specific company:
```http theme={null}
POST /v1/reports/sentiment HTTP/1.1
Content-Type: application/json
X-API-Key: your_api_key
{
"category_id": "your_category_id",
"start_date": "2026-01-01",
"end_date": "2026-01-07",
"metrics": ["positive", "negative"],
"dimensions": ["theme"],
"pagination": {
"limit": 5
},
"filters": [
{
"field": "asset_name",
"operator": "is",
"value": "your_company_name"
}
]
}
```
```json theme={null}
{
"info": {}, // removed for brevity
"data": [
{
"metrics": [12, 45],
"dimensions": ["Customer Support"]
},
{
"metrics": [8, 32],
"dimensions": ["Pricing"]
},
{
"metrics": [6, 28],
"dimensions": ["Ease of Use"]
},
{
"metrics": [4, 50],
"dimensions": ["Product Quality"]
},
{
"metrics": [2, 18],
"dimensions": ["Integration"]
}
]
}
```
**Use case:** Identify themes driving positive or negative sentiment for targeted improvements.
## Citation Reports
Track mentions, references, and citation patterns across domains and pages. See the full [endpoint reference](/api-reference/reports/query-citations) for all available metrics, dimensions, and filters.
The same filter composition shown in [Mixed AND/OR Tag Filtering](#mixed-and%2For-tag-filtering) works on this endpoint.
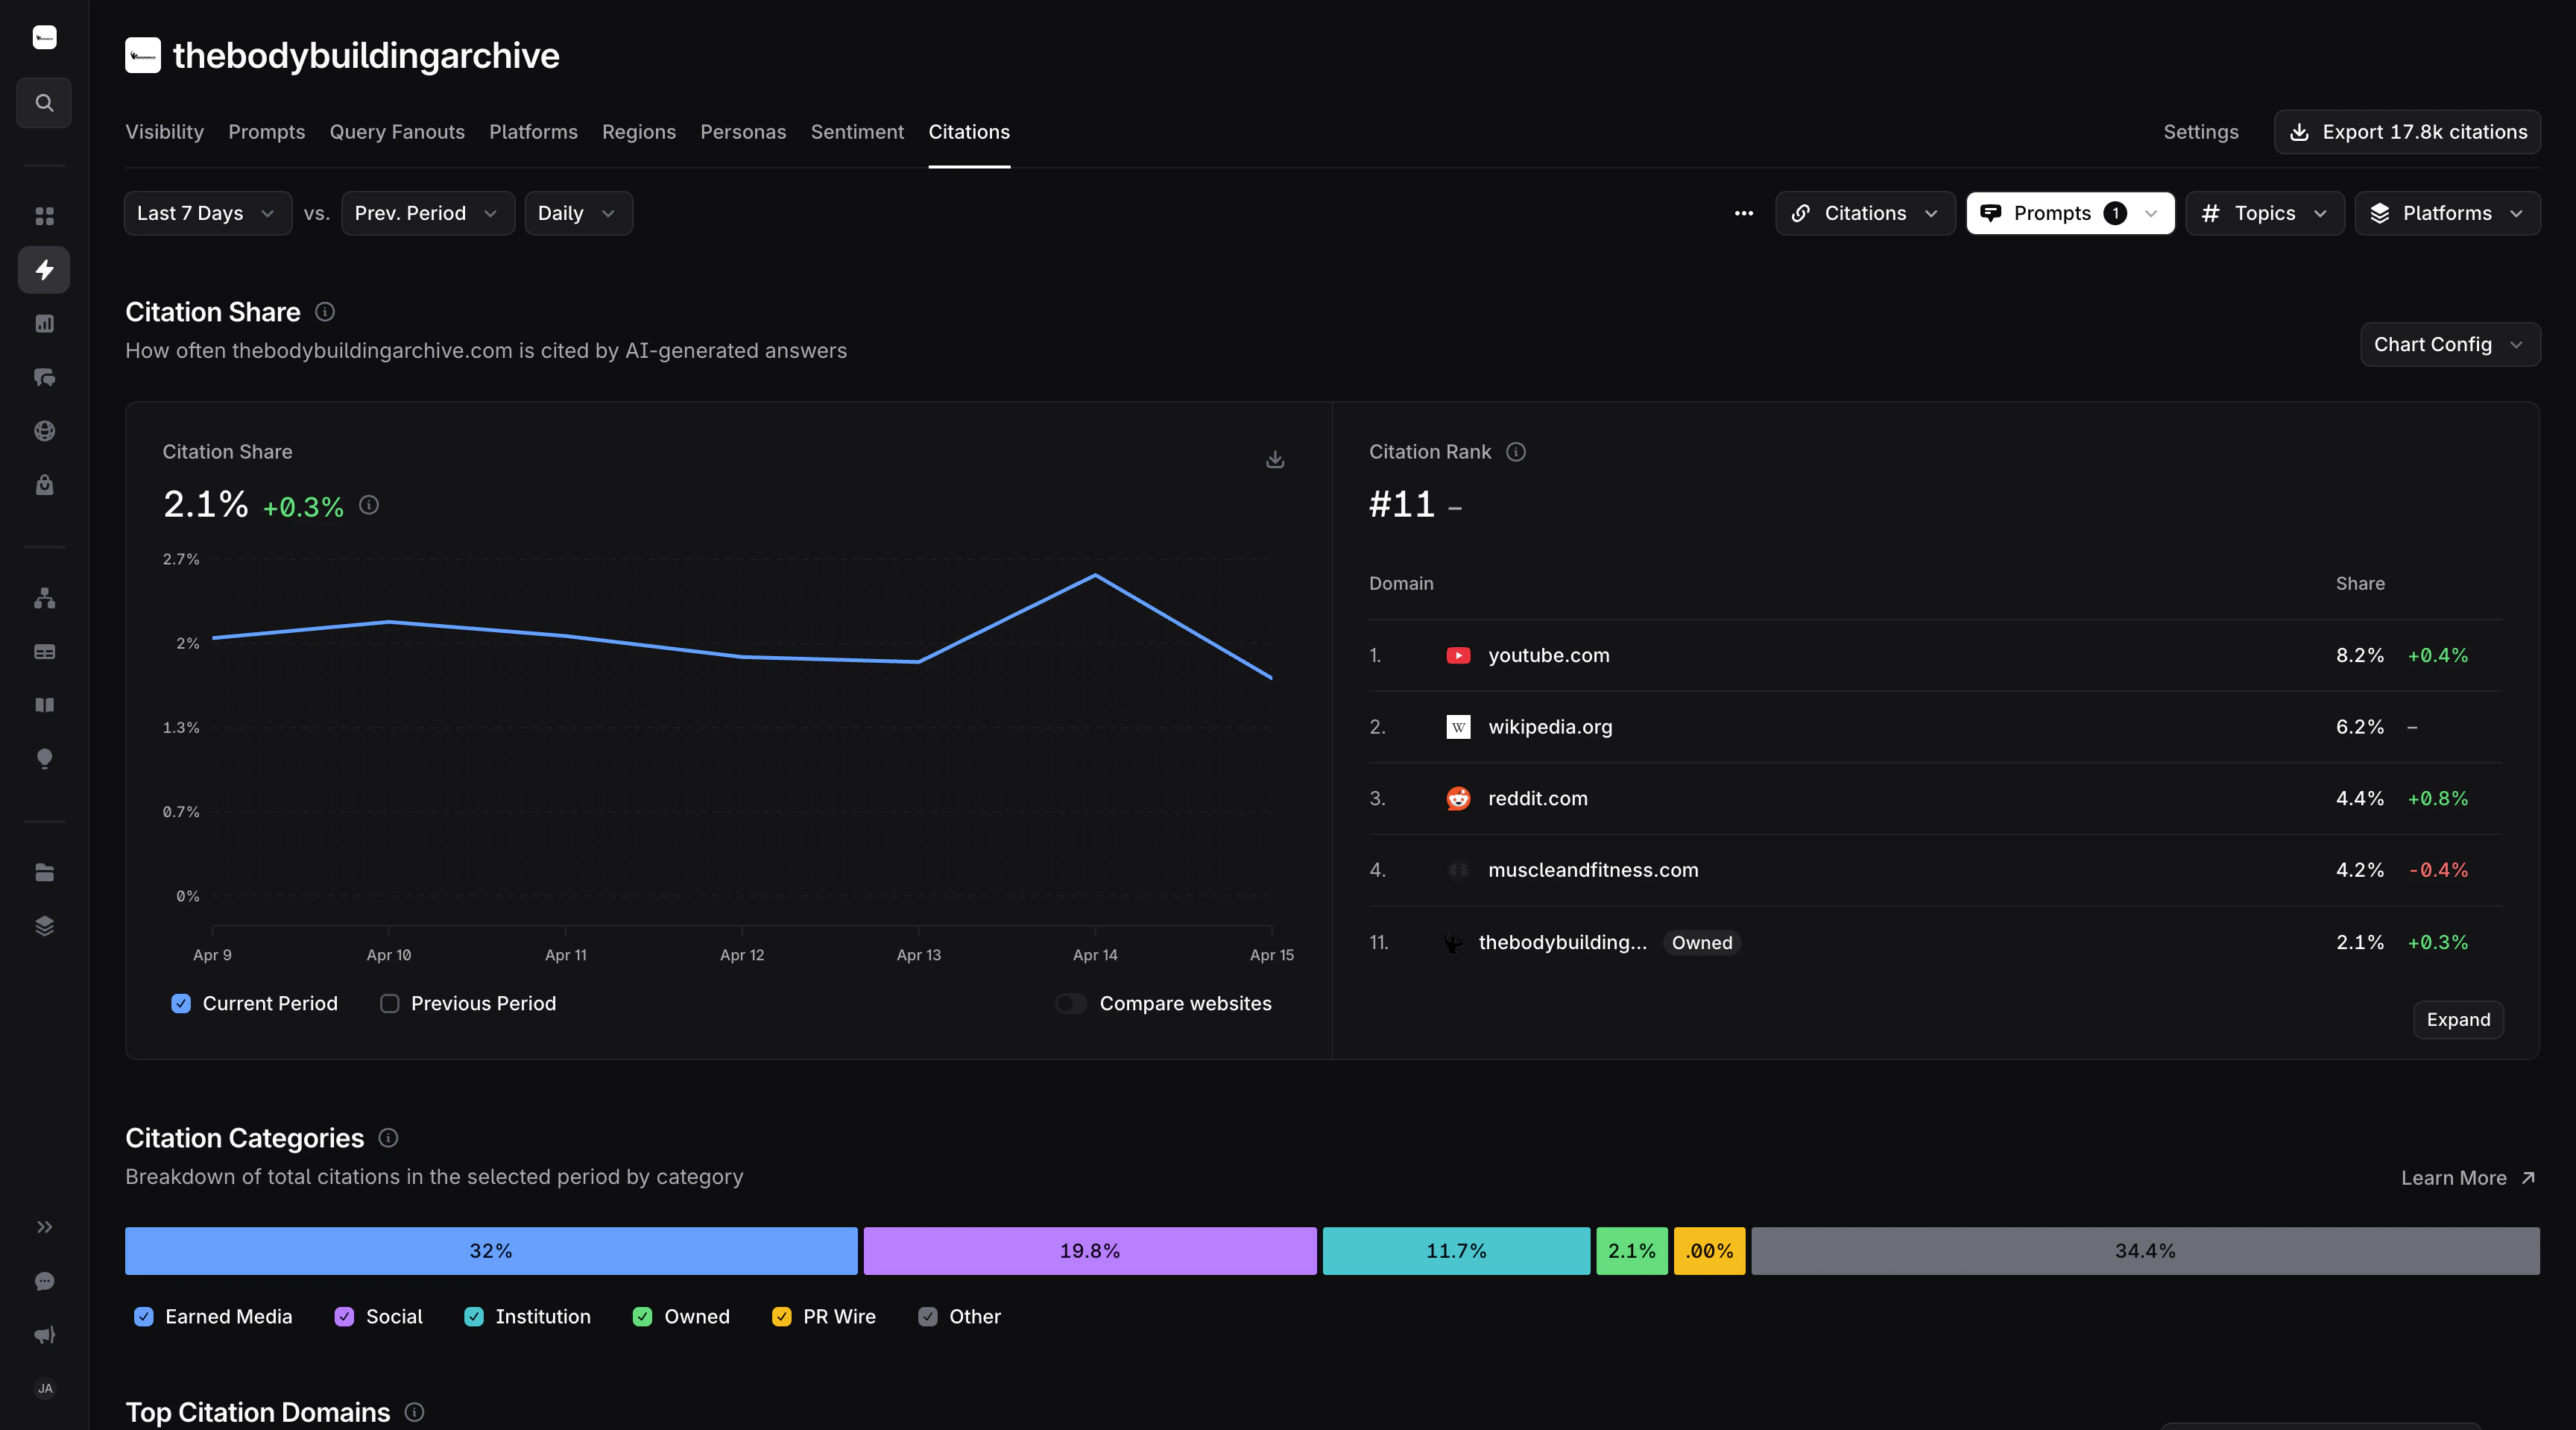 Track citation share by domain with daily granularity:
```http theme={null}
POST /v1/reports/citations HTTP/1.1
Content-Type: application/json
X-API-Key: your_api_key
{
"category_id": "your_category_id",
"start_date": "2026-04-08",
"end_date": "2026-04-15",
"metrics": ["citation_share"],
"dimensions": ["date", "hostname"],
"date_interval": "day",
"order_by": { "date": "asc" }
}
```
```json theme={null}
{
"info": {}, // removed for brevity
"data": [
{ "metrics": [0.092], "dimensions": ["2026-04-08 00:00:00", "example-a.com"] },
{ "metrics": [0.028], "dimensions": ["2026-04-08 00:00:00", "example-b.com"] },
{ "metrics": [0.021], "dimensions": ["2026-04-08 00:00:00", "example-c.com"] },
{ "metrics": [0.018], "dimensions": ["2026-04-08 00:00:00", "example-d.com"] },
{ "metrics": [0.015], "dimensions": ["2026-04-08 00:00:00", "example-e.com"] },
{ "metrics": [0.105], "dimensions": ["2026-04-09 00:00:00", "example-a.com"] },
{ "metrics": [0.030], "dimensions": ["2026-04-09 00:00:00", "example-b.com"] },
{ "metrics": [0.024], "dimensions": ["2026-04-09 00:00:00", "example-c.com"] },
{ "metrics": [0.019], "dimensions": ["2026-04-09 00:00:00", "example-d.com"] },
{ "metrics": [0.013], "dimensions": ["2026-04-09 00:00:00", "example-e.com"] },
{ "metrics": [0.088], "dimensions": ["2026-04-10 00:00:00", "example-a.com"] },
{ "metrics": [0.026], "dimensions": ["2026-04-10 00:00:00", "example-b.com"] }
]
}
```
**Use case:** Monitor how citation share trends over time across competing domains.
Get the top 5 domains ranked by citation share with total citation count:
```http theme={null}
POST /v1/reports/citations HTTP/1.1
Content-Type: application/json
X-API-Key: your_api_key
{
"category_id": "your_category_id",
"start_date": "2026-04-08",
"end_date": "2026-04-15",
"metrics": ["citation_share", "count"],
"dimensions": ["hostname"],
"order_by": { "citation_share": "desc" },
"pagination": { "limit": 5 }
}
```
```json theme={null}
{
"info": {}, // removed for brevity
"data": [
{ "metrics": [0.087, 358], "dimensions": ["example-a.com"] },
{ "metrics": [0.025, 102], "dimensions": ["example-b.com"] },
{ "metrics": [0.023, 95], "dimensions": ["example-c.com"] },
{ "metrics": [0.019, 78], "dimensions": ["example-d.com"] },
{ "metrics": [0.015, 61], "dimensions": ["example-e.com"] }
]
}
```
**Use case:** Identify the most cited domains in your category and their relative share.
Track citation share by domain with daily granularity:
```http theme={null}
POST /v1/reports/citations HTTP/1.1
Content-Type: application/json
X-API-Key: your_api_key
{
"category_id": "your_category_id",
"start_date": "2026-04-08",
"end_date": "2026-04-15",
"metrics": ["citation_share"],
"dimensions": ["date", "hostname"],
"date_interval": "day",
"order_by": { "date": "asc" }
}
```
```json theme={null}
{
"info": {}, // removed for brevity
"data": [
{ "metrics": [0.092], "dimensions": ["2026-04-08 00:00:00", "example-a.com"] },
{ "metrics": [0.028], "dimensions": ["2026-04-08 00:00:00", "example-b.com"] },
{ "metrics": [0.021], "dimensions": ["2026-04-08 00:00:00", "example-c.com"] },
{ "metrics": [0.018], "dimensions": ["2026-04-08 00:00:00", "example-d.com"] },
{ "metrics": [0.015], "dimensions": ["2026-04-08 00:00:00", "example-e.com"] },
{ "metrics": [0.105], "dimensions": ["2026-04-09 00:00:00", "example-a.com"] },
{ "metrics": [0.030], "dimensions": ["2026-04-09 00:00:00", "example-b.com"] },
{ "metrics": [0.024], "dimensions": ["2026-04-09 00:00:00", "example-c.com"] },
{ "metrics": [0.019], "dimensions": ["2026-04-09 00:00:00", "example-d.com"] },
{ "metrics": [0.013], "dimensions": ["2026-04-09 00:00:00", "example-e.com"] },
{ "metrics": [0.088], "dimensions": ["2026-04-10 00:00:00", "example-a.com"] },
{ "metrics": [0.026], "dimensions": ["2026-04-10 00:00:00", "example-b.com"] }
]
}
```
**Use case:** Monitor how citation share trends over time across competing domains.
Get the top 5 domains ranked by citation share with total citation count:
```http theme={null}
POST /v1/reports/citations HTTP/1.1
Content-Type: application/json
X-API-Key: your_api_key
{
"category_id": "your_category_id",
"start_date": "2026-04-08",
"end_date": "2026-04-15",
"metrics": ["citation_share", "count"],
"dimensions": ["hostname"],
"order_by": { "citation_share": "desc" },
"pagination": { "limit": 5 }
}
```
```json theme={null}
{
"info": {}, // removed for brevity
"data": [
{ "metrics": [0.087, 358], "dimensions": ["example-a.com"] },
{ "metrics": [0.025, 102], "dimensions": ["example-b.com"] },
{ "metrics": [0.023, 95], "dimensions": ["example-c.com"] },
{ "metrics": [0.019, 78], "dimensions": ["example-d.com"] },
{ "metrics": [0.015, 61], "dimensions": ["example-e.com"] }
]
}
```
**Use case:** Identify the most cited domains in your category and their relative share.
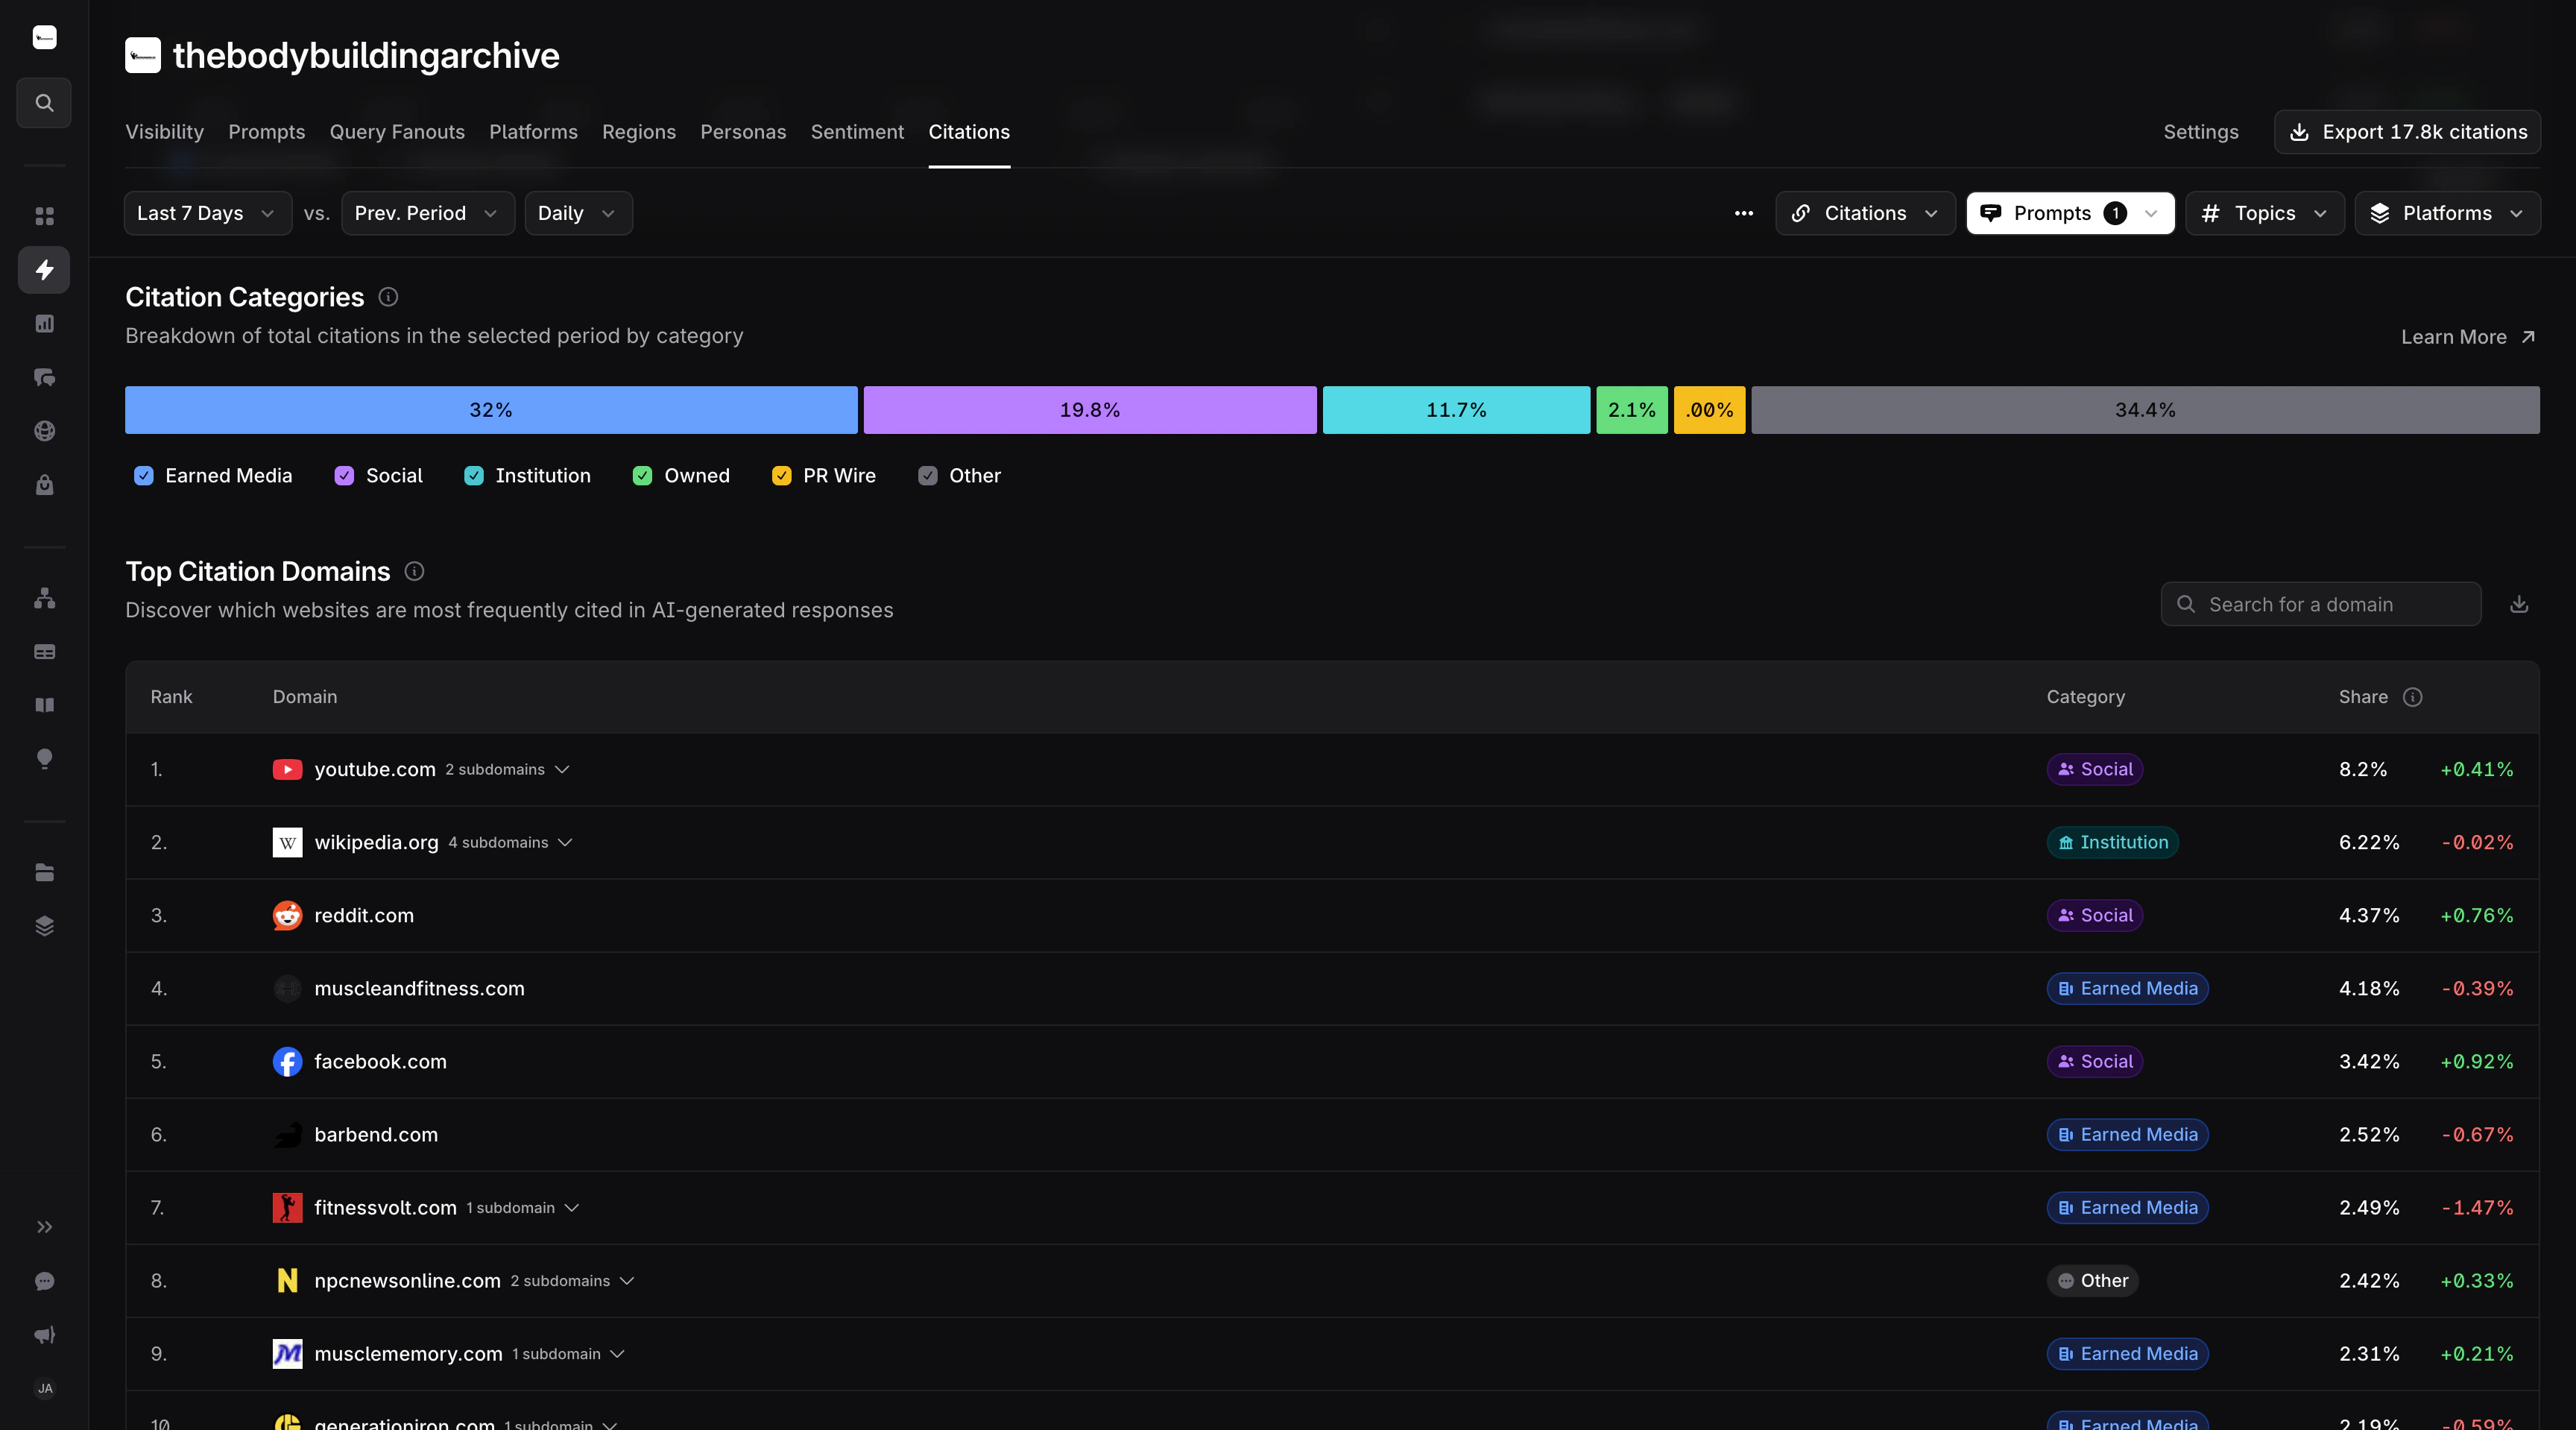 Get citation share and count broken down by citation category:
```http theme={null}
POST /v1/reports/citations HTTP/1.1
Content-Type: application/json
X-API-Key: your_api_key
{
"category_id": "your_category_id",
"start_date": "2026-04-08",
"end_date": "2026-04-15",
"metrics": ["citation_share", "count"],
"dimensions": ["citation_category"],
"order_by": { "citation_share": "desc" }
}
```
```json theme={null}
{
"info": {}, // removed for brevity
"data": [
{ "metrics": [0.136, 542], "dimensions": ["Earned Media"] },
{ "metrics": [0.115, 458], "dimensions": ["Social"] },
{ "metrics": [0.079, 315], "dimensions": ["Owned"] },
{ "metrics": [0.053, 211], "dimensions": ["Competition"] },
{ "metrics": [0.034, 136], "dimensions": ["Blog"] },
{ "metrics": [0.028, 112], "dimensions": ["Partner"] },
{ "metrics": [0.024, 96], "dimensions": ["Distribution"] },
{ "metrics": [0.020, 80], "dimensions": ["Documentation"] },
{ "metrics": [0.016, 64], "dimensions": ["Press"] },
{ "metrics": [0.012, 48], "dimensions": ["Video"] },
{ "metrics": [0.010, 40], "dimensions": ["other"] }
]
}
```
**Use case:** Understand which citation categories drive the most mentions in your category.
Get the top 10 cited domains by citation share and count, grouped by citation category:
```http theme={null}
POST /v1/reports/citations HTTP/1.1
Content-Type: application/json
X-API-Key: your_api_key
{
"category_id": "your_category_id",
"start_date": "2026-04-08",
"end_date": "2026-04-15",
"metrics": ["citation_share", "count"],
"dimensions": ["citation_category", "hostname"],
"order_by": { "citation_share": "desc" },
"pagination": { "limit": 10 }
}
```
```json theme={null}
{
"info": {}, // removed for brevity
"data": [
{ "metrics": [0.038, 152], "dimensions": ["Earned Media", "example-a.com"] },
{ "metrics": [0.035, 140], "dimensions": ["Social", "example-f.com"] },
{ "metrics": [0.028, 112], "dimensions": ["Earned Media", "example-b.com"] },
{ "metrics": [0.025, 100], "dimensions": ["Earned Media", "example-c.com"] },
{ "metrics": [0.024, 96], "dimensions": ["Social", "example-g.com"] },
{ "metrics": [0.021, 84], "dimensions": ["other", "example-d.com"] },
{ "metrics": [0.018, 72], "dimensions": ["Social", "example-h.com"] },
{ "metrics": [0.015, 60], "dimensions": ["Earned Media", "example-e.com"] }
]
}
```
**Use case:** Identify the top 10 most cited domains and which citation category they belong to.
## Raw Data Access
Access unprocessed prompt and answer data for custom analysis. See the full [endpoint reference](/api-reference/prompts/get-answers) for all available parameters and filters.
Get all visibility answers for a date range:
```http theme={null}
POST /v1/prompts/answers HTTP/1.1
Content-Type: application/json
X-API-Key: your_api_key
{
"category_id": "your_category_id",
"start_date": "2026-01-01",
"end_date": "2026-01-07",
"filters": [
{
"field": "prompt_type",
"operator": "is",
"value": "visibility"
}
]
}
```
```json theme={null}
{
"info": {}, // removed for brevity
"data": [
{
"created_at": "2026-01-01T08:15:00Z",
"prompt": "What are the best project management tools?",
"mentions": ["Company A", "Company B", "Company C"],
"prompt_type": "open-ended",
"response": "There are several leading project management tools available today. Company A offers comprehensive project tracking with built-in collaboration features...",
"citations": ["https://www.example.com/reviews", "https://www.example.com/best-tools"],
"themes": ["feature comparison", "pricing"],
"topic": "Project Management",
"region": "North America",
"model": "ChatGPT",
"model_id": "3f8a1b2c-1234-5678-abcd-ef0123456789",
"asset": "Company A"
},
...
]
}
```
**Use case:** Build custom dashboards and perform specialized analysis with raw answer data.
Get sentiment prompt answers filtered by a specific asset:
```http theme={null}
POST /v1/prompts/answers HTTP/1.1
Content-Type: application/json
X-API-Key: your_api_key
{
"category_id": "your_category_id",
"start_date": "2026-01-01",
"end_date": "2026-01-07",
"filters": [
{
"field": "prompt_type",
"operator": "is",
"value": "sentiment"
},
{
"field": "asset_name",
"operator": "is",
"value": "your_company_name"
}
]
}
```
```json theme={null}
{
"info": {}, // removed for brevity
"data": [
{
"created_at": "2026-01-02T11:30:00Z",
"prompt": "What do users think about Company A's analytics features?",
"mentions": ["Company A"],
"prompt_type": "brand-direct",
"response": "Users generally have positive feedback about Company A's analytics capabilities. The platform is praised for its comprehensive dashboard and intuitive reporting features...",
"citations": ["https://www.example.com/review/company-a"],
"themes": ["analytics quality", "ease of use"],
"topic": "Product Feedback",
"region": "Europe",
"model": "Perplexity",
"model_id": "c4d5e6f7-3456-7890-cdef-012345678901",
"asset": "Company A"
},
...
]
}
```
**Use case:** Analyze raw sentiment responses for a specific brand across models and regions.
Get citation share and count broken down by citation category:
```http theme={null}
POST /v1/reports/citations HTTP/1.1
Content-Type: application/json
X-API-Key: your_api_key
{
"category_id": "your_category_id",
"start_date": "2026-04-08",
"end_date": "2026-04-15",
"metrics": ["citation_share", "count"],
"dimensions": ["citation_category"],
"order_by": { "citation_share": "desc" }
}
```
```json theme={null}
{
"info": {}, // removed for brevity
"data": [
{ "metrics": [0.136, 542], "dimensions": ["Earned Media"] },
{ "metrics": [0.115, 458], "dimensions": ["Social"] },
{ "metrics": [0.079, 315], "dimensions": ["Owned"] },
{ "metrics": [0.053, 211], "dimensions": ["Competition"] },
{ "metrics": [0.034, 136], "dimensions": ["Blog"] },
{ "metrics": [0.028, 112], "dimensions": ["Partner"] },
{ "metrics": [0.024, 96], "dimensions": ["Distribution"] },
{ "metrics": [0.020, 80], "dimensions": ["Documentation"] },
{ "metrics": [0.016, 64], "dimensions": ["Press"] },
{ "metrics": [0.012, 48], "dimensions": ["Video"] },
{ "metrics": [0.010, 40], "dimensions": ["other"] }
]
}
```
**Use case:** Understand which citation categories drive the most mentions in your category.
Get the top 10 cited domains by citation share and count, grouped by citation category:
```http theme={null}
POST /v1/reports/citations HTTP/1.1
Content-Type: application/json
X-API-Key: your_api_key
{
"category_id": "your_category_id",
"start_date": "2026-04-08",
"end_date": "2026-04-15",
"metrics": ["citation_share", "count"],
"dimensions": ["citation_category", "hostname"],
"order_by": { "citation_share": "desc" },
"pagination": { "limit": 10 }
}
```
```json theme={null}
{
"info": {}, // removed for brevity
"data": [
{ "metrics": [0.038, 152], "dimensions": ["Earned Media", "example-a.com"] },
{ "metrics": [0.035, 140], "dimensions": ["Social", "example-f.com"] },
{ "metrics": [0.028, 112], "dimensions": ["Earned Media", "example-b.com"] },
{ "metrics": [0.025, 100], "dimensions": ["Earned Media", "example-c.com"] },
{ "metrics": [0.024, 96], "dimensions": ["Social", "example-g.com"] },
{ "metrics": [0.021, 84], "dimensions": ["other", "example-d.com"] },
{ "metrics": [0.018, 72], "dimensions": ["Social", "example-h.com"] },
{ "metrics": [0.015, 60], "dimensions": ["Earned Media", "example-e.com"] }
]
}
```
**Use case:** Identify the top 10 most cited domains and which citation category they belong to.
## Raw Data Access
Access unprocessed prompt and answer data for custom analysis. See the full [endpoint reference](/api-reference/prompts/get-answers) for all available parameters and filters.
Get all visibility answers for a date range:
```http theme={null}
POST /v1/prompts/answers HTTP/1.1
Content-Type: application/json
X-API-Key: your_api_key
{
"category_id": "your_category_id",
"start_date": "2026-01-01",
"end_date": "2026-01-07",
"filters": [
{
"field": "prompt_type",
"operator": "is",
"value": "visibility"
}
]
}
```
```json theme={null}
{
"info": {}, // removed for brevity
"data": [
{
"created_at": "2026-01-01T08:15:00Z",
"prompt": "What are the best project management tools?",
"mentions": ["Company A", "Company B", "Company C"],
"prompt_type": "open-ended",
"response": "There are several leading project management tools available today. Company A offers comprehensive project tracking with built-in collaboration features...",
"citations": ["https://www.example.com/reviews", "https://www.example.com/best-tools"],
"themes": ["feature comparison", "pricing"],
"topic": "Project Management",
"region": "North America",
"model": "ChatGPT",
"model_id": "3f8a1b2c-1234-5678-abcd-ef0123456789",
"asset": "Company A"
},
...
]
}
```
**Use case:** Build custom dashboards and perform specialized analysis with raw answer data.
Get sentiment prompt answers filtered by a specific asset:
```http theme={null}
POST /v1/prompts/answers HTTP/1.1
Content-Type: application/json
X-API-Key: your_api_key
{
"category_id": "your_category_id",
"start_date": "2026-01-01",
"end_date": "2026-01-07",
"filters": [
{
"field": "prompt_type",
"operator": "is",
"value": "sentiment"
},
{
"field": "asset_name",
"operator": "is",
"value": "your_company_name"
}
]
}
```
```json theme={null}
{
"info": {}, // removed for brevity
"data": [
{
"created_at": "2026-01-02T11:30:00Z",
"prompt": "What do users think about Company A's analytics features?",
"mentions": ["Company A"],
"prompt_type": "brand-direct",
"response": "Users generally have positive feedback about Company A's analytics capabilities. The platform is praised for its comprehensive dashboard and intuitive reporting features...",
"citations": ["https://www.example.com/review/company-a"],
"themes": ["analytics quality", "ease of use"],
"topic": "Product Feedback",
"region": "Europe",
"model": "Perplexity",
"model_id": "c4d5e6f7-3456-7890-cdef-012345678901",
"asset": "Company A"
},
...
]
}
```
**Use case:** Analyze raw sentiment responses for a specific brand across models and regions.