This feature is available to Enterprise customers with at least 10 Agent runs. Not on an Enterprise plan yet? Request a demo to see what’s possible.
Step 1: Navigate to Command Center
Select your organization name at the top left of the platform, then select Settings.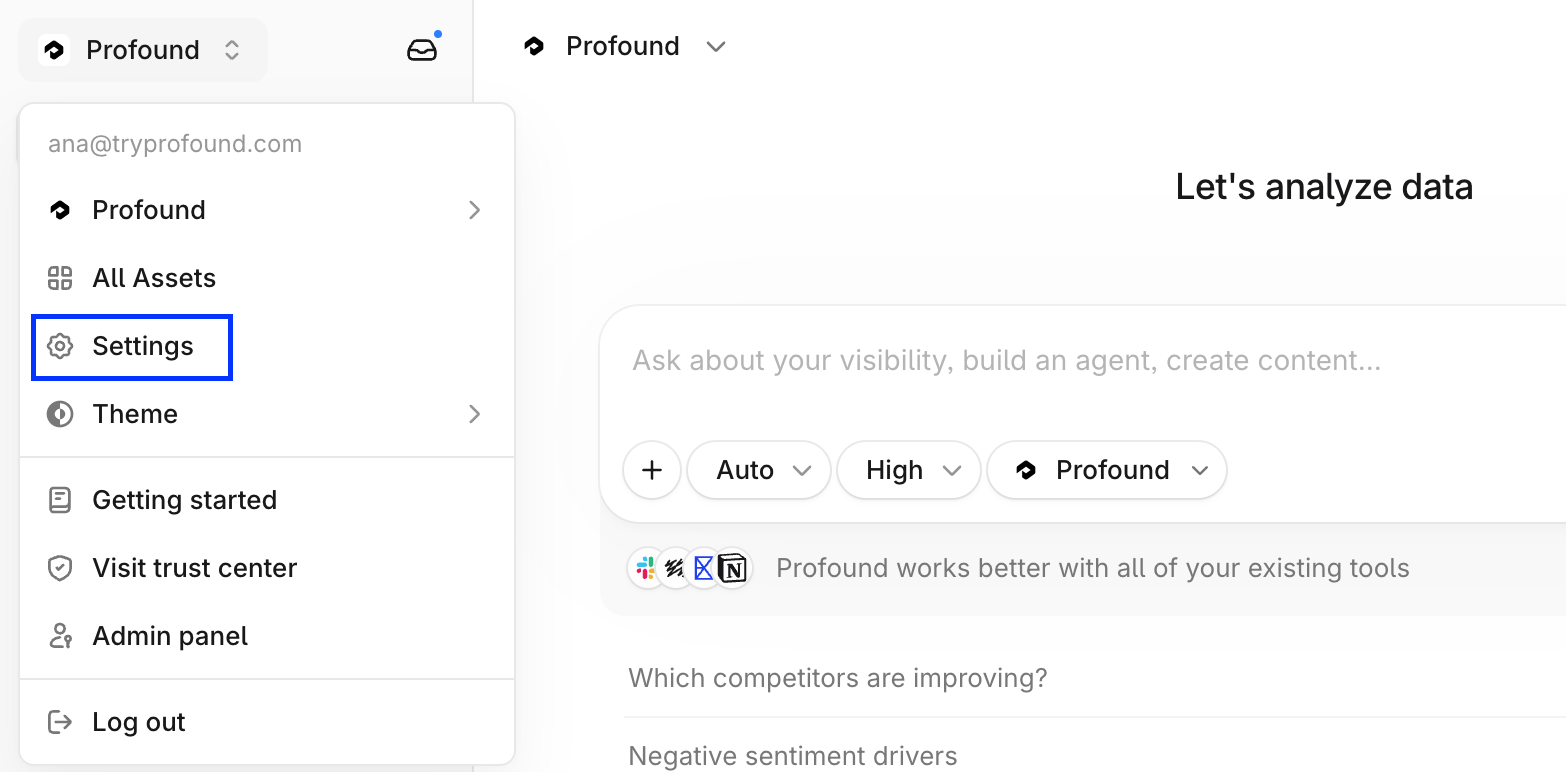
Step 2: Review your team’s usage
- Scan your Overall Performance graphs: Active Users, Agent Runs, Total Hours Saved, and Projects Tracked.
- Then check the Platform Usage metrics: Power Users leaderboard and Agent Usage by Category.
- Use the View filter to switch between Total (metrics for all time) and Time Frame (metrics for the set time frame).
Step 3: Customize your average process time values
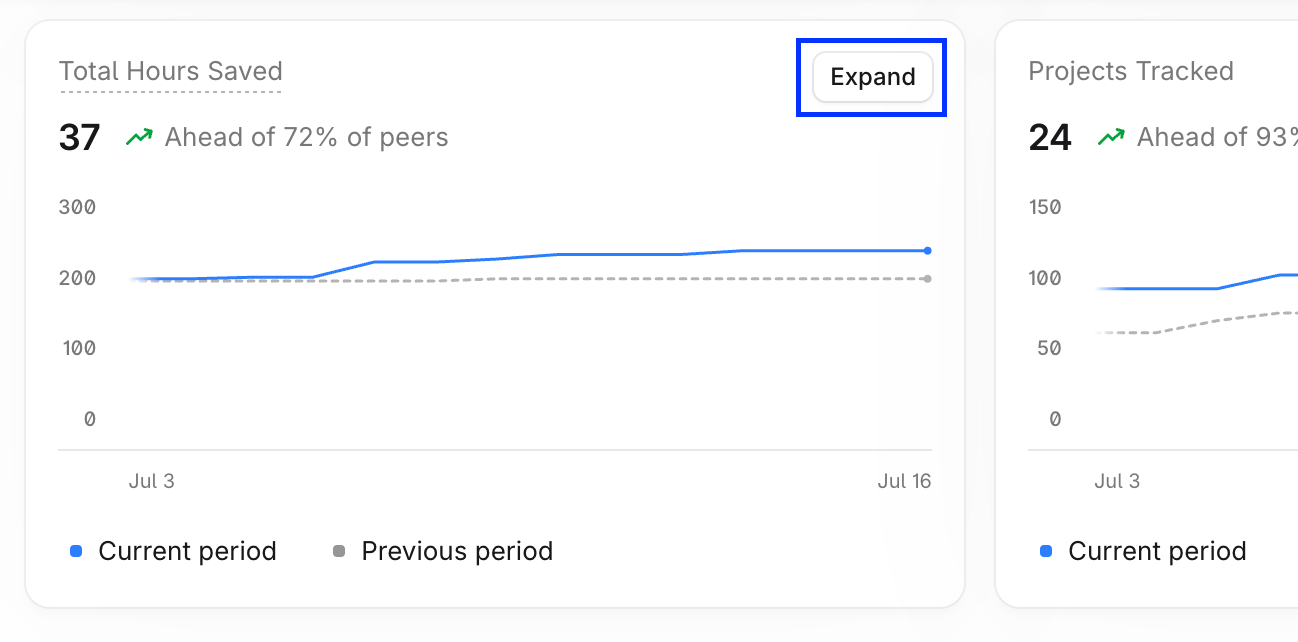
- Select Expand on the Total Hours Saved card.
- select Edit Average Process Time in the Total Hours Saved Breakdown.
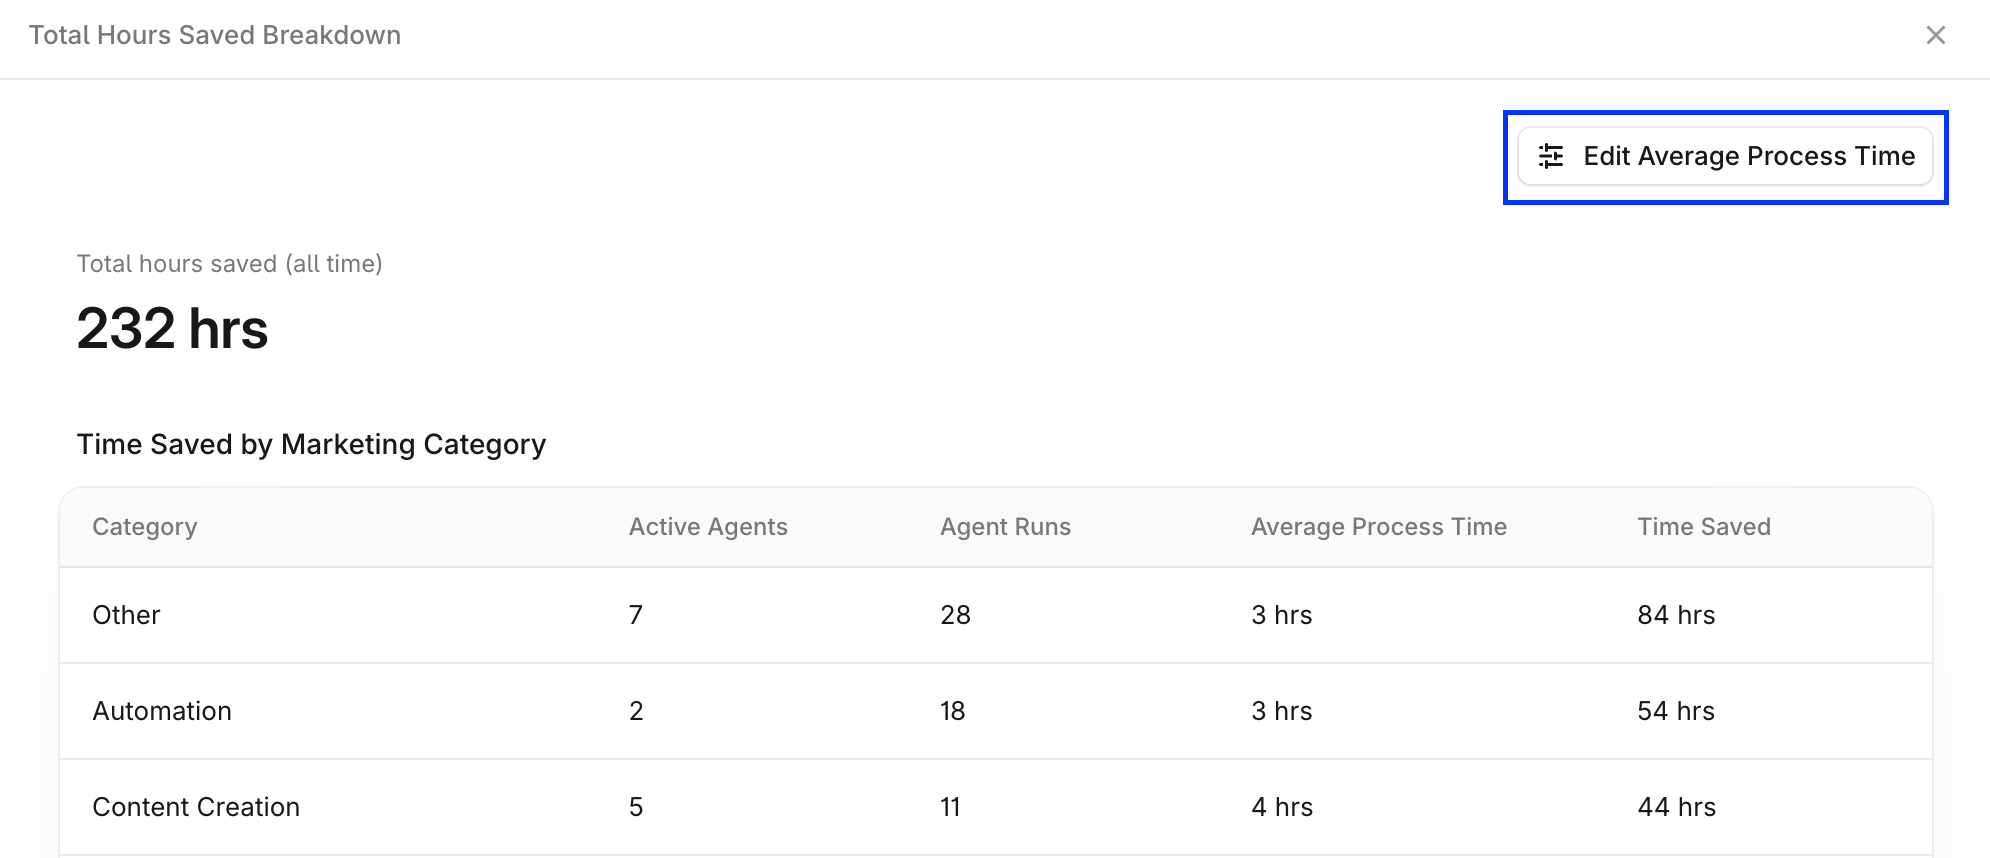
- Adjust the hours per category so the hours saved figure reflects how long these tasks take your team.
Step 4: Set your benchmark
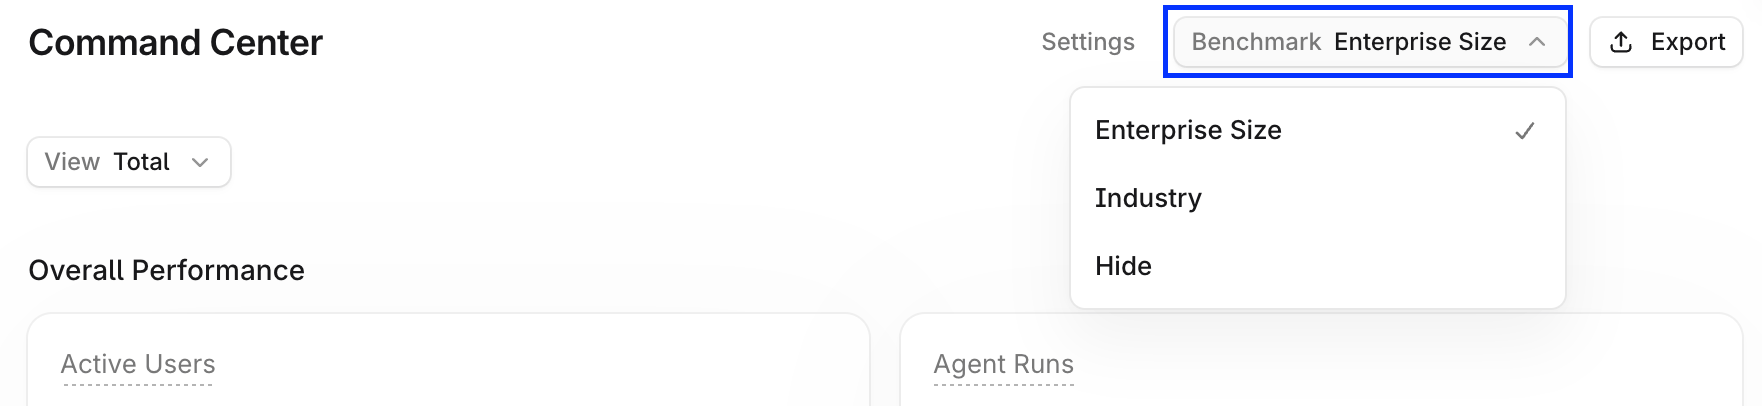
Use the Benchmark filter to compare your metrics by Enterprise Size or Industry. Select Hide if you want to view your numbers without the comparison.