

your_api_key、your_category_id、your_company_name を実際の値に
置き換えてください。カテゴリ ID は /v1/org/categories から取得できます。すべての例では簡略化した日付形式を使用しています。本番環境で使用する場合は、日付範囲とタイムゾーン を読み、タイムゾーンの扱いを理解して、日付パラメーターに関するよくある落とし穴を避けてください。
可視性レポート
特定のカテゴリ内の企業について、可視性の指標とパフォーマンスデータを取得します。利用可能なすべての指標、ディメンション、フィルターについては、エンドポイントリファレンス を参照してください。- Visibility Score
- Share of Voice
- Average Position
- トピック別ランキング
- AND/OR を組み合わせたタグフィルタリング
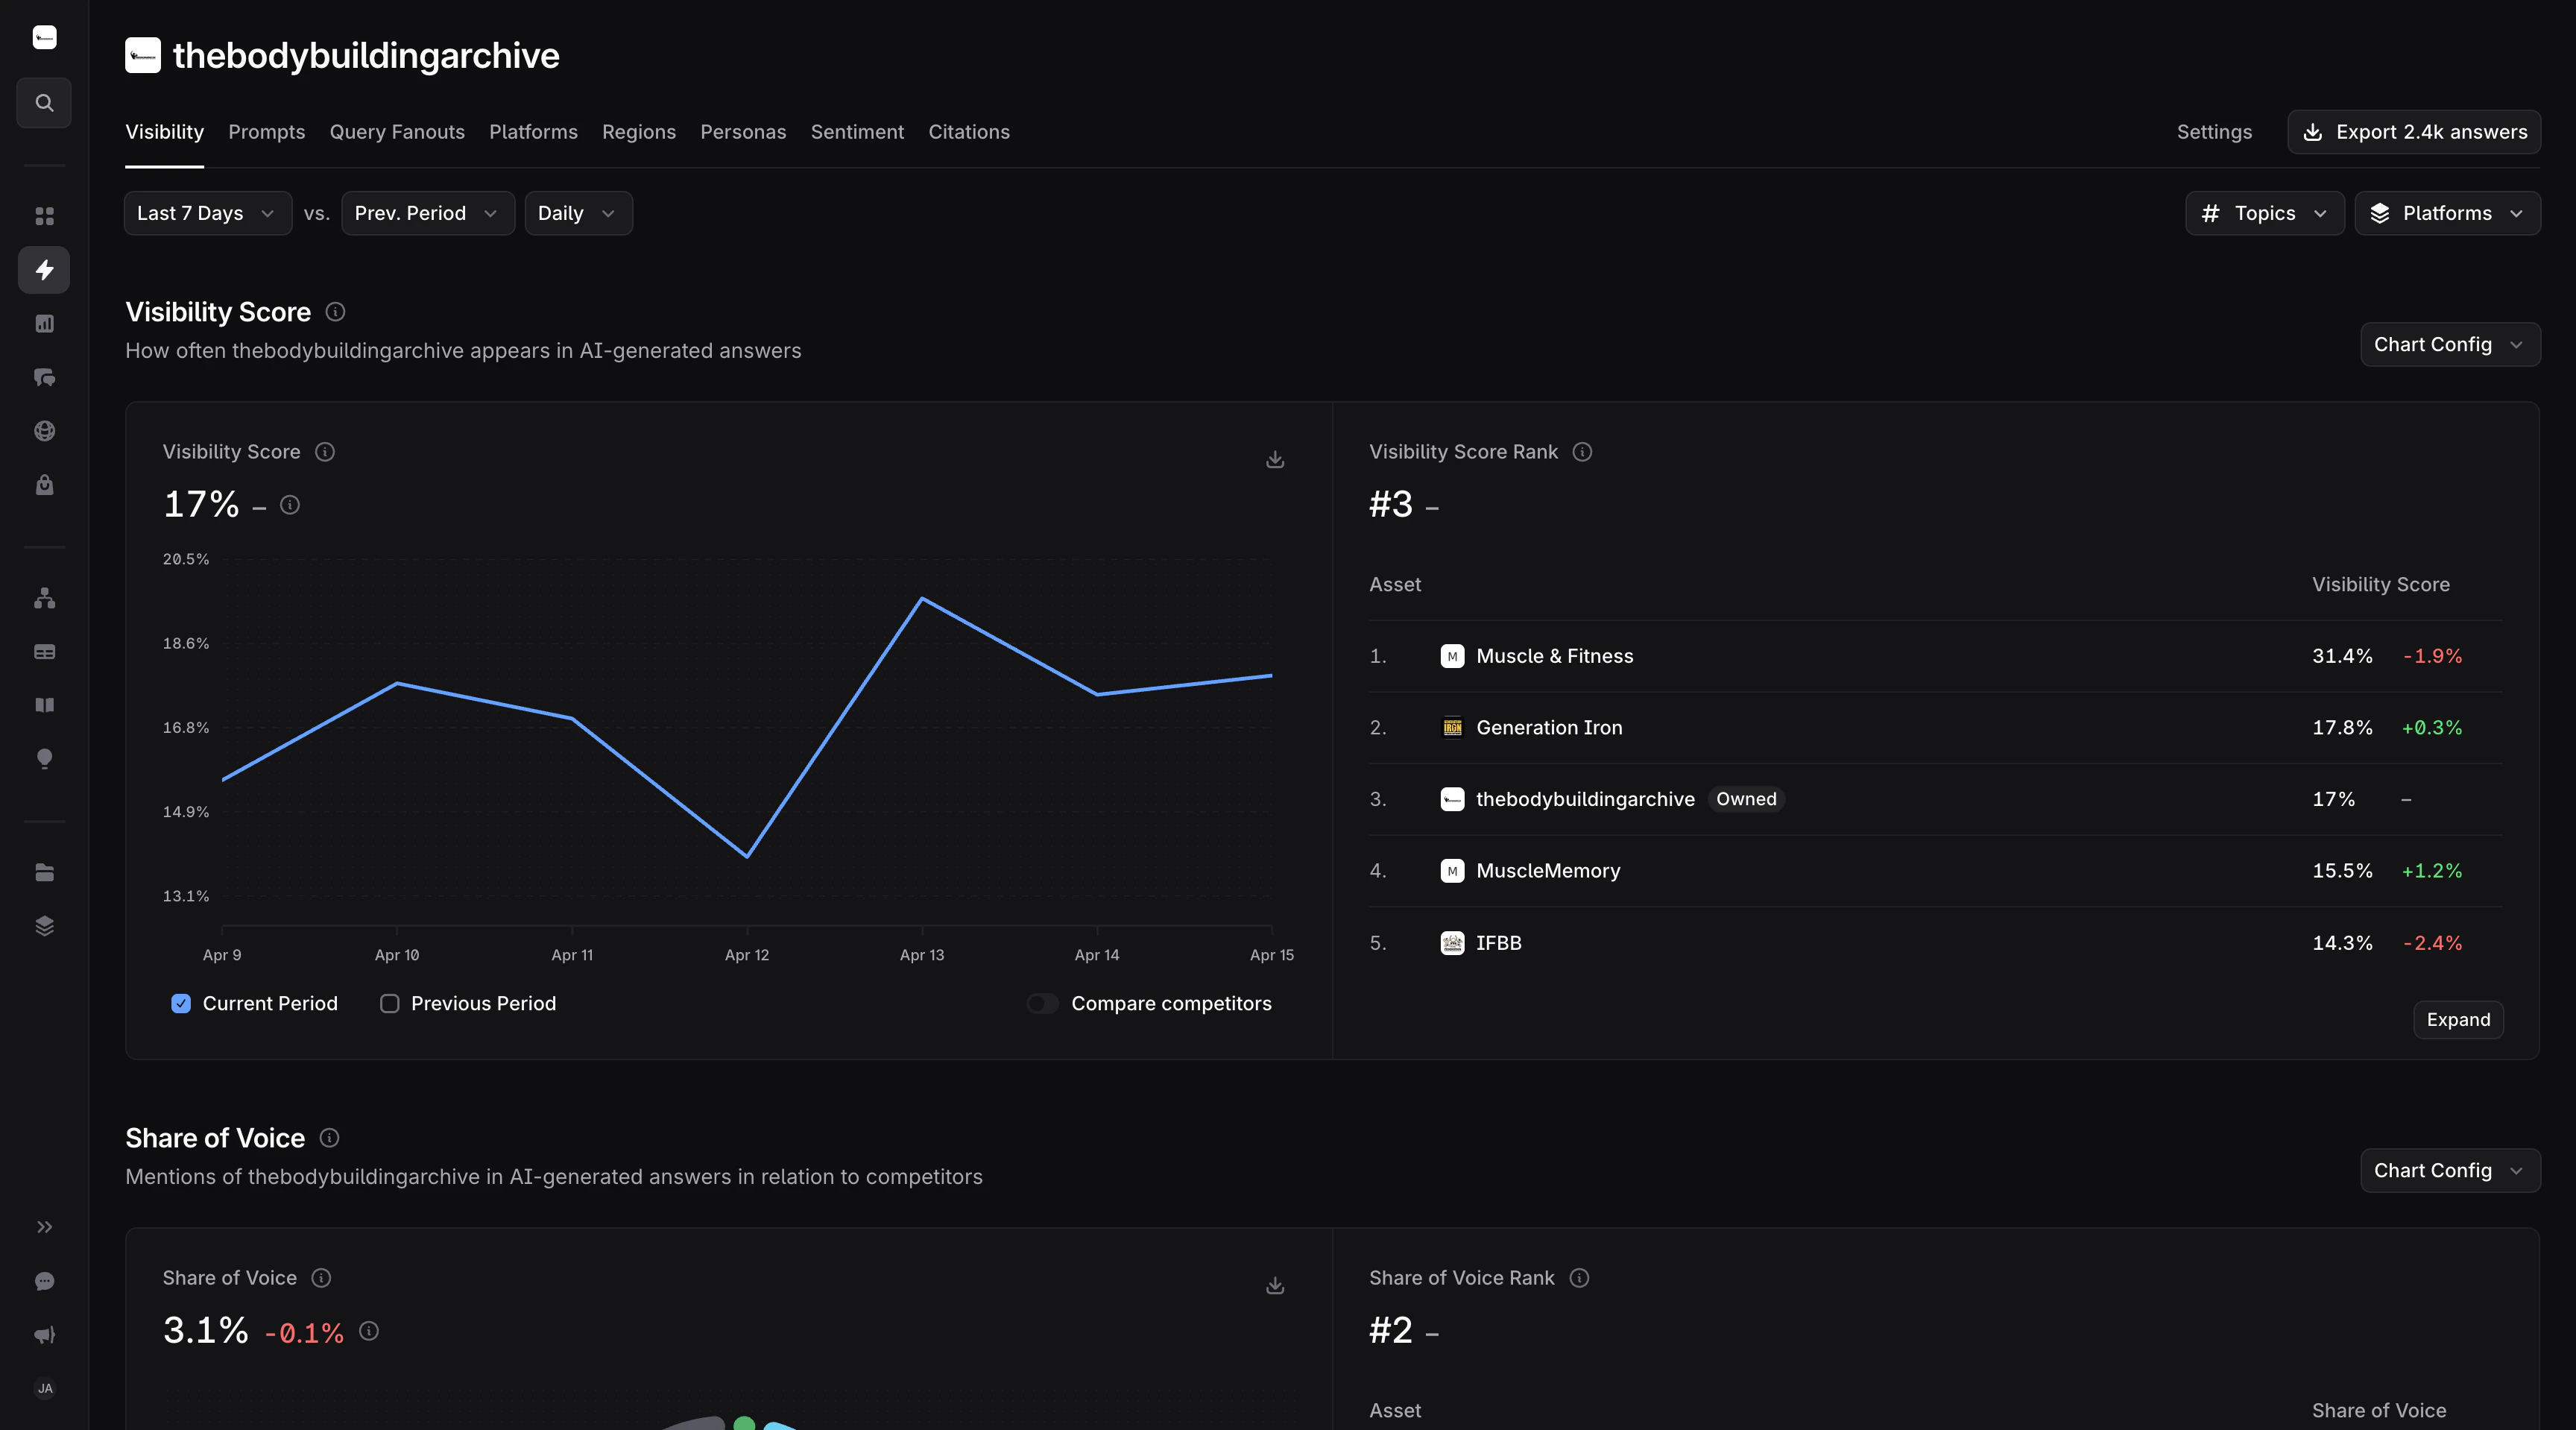
- 企業の可視性の推移
- Visibility Score 上位 5 社
特定の企業の可視性パフォーマンスを日単位の粒度で追跡します。ユースケース: 日々のパフォーマンスの変化をモニタリングし、トレンドを特定します。
POST /v1/reports/visibility HTTP/1.1
Content-Type: application/json
X-API-Key: your_api_key

{
  "category_id": "your_category_id",
  "start_date": "2026-01-01",
  "end_date": "2026-01-07",
  "date_interval": "day",
  "metrics": ["visibility_score"],
  "dimensions": ["date"],
  "filters": [
    {
      "field": "asset_name",
      "operator": "is",
      "value": "your_company_name"
    }
  ]
}
{
  "info": {},  // removed for brevity
  "data": [
    { "metrics": [0.45], "dimensions": ["2026-01-01"] },
    { "metrics": [0.48], "dimensions": ["2026-01-02"] },
    { "metrics": [0.52], "dimensions": ["2026-01-03"] },
    { "metrics": [0.51], "dimensions": ["2026-01-04"] },
    { "metrics": [0.55], "dimensions": ["2026-01-05"] },
    { "metrics": [0.58], "dimensions": ["2026-01-06"] },
    { "metrics": [0.60], "dimensions": ["2026-01-07"] }
  ]
}
カテゴリ内で Visibility Score が最も高い上位 5 社を取得します。ユースケース: 市場のリーダーを特定し、トップパフォーマーとベンチマークします。
POST /v1/reports/visibility HTTP/1.1
Content-Type: application/json
X-API-Key: your_api_key

{
  "category_id": "your_category_id",
  "start_date": "2026-01-01",
  "end_date": "2026-01-07",
  "metrics": ["visibility_score"],
  "dimensions": ["asset_name"],
  "pagination": {
    "limit": 5
  }
}
{
  "info": {},  // removed for brevity
  "data": [
    { "metrics": [0.583], "dimensions": ["Company A"] },
    { "metrics": [0.343], "dimensions": ["Company B"] },
    { "metrics": [0.231], "dimensions": ["Company C"] },
    { "metrics": [0.216], "dimensions": ["Company D"] },
    { "metrics": [0.173], "dimensions": ["Company E"] }
  ]
}
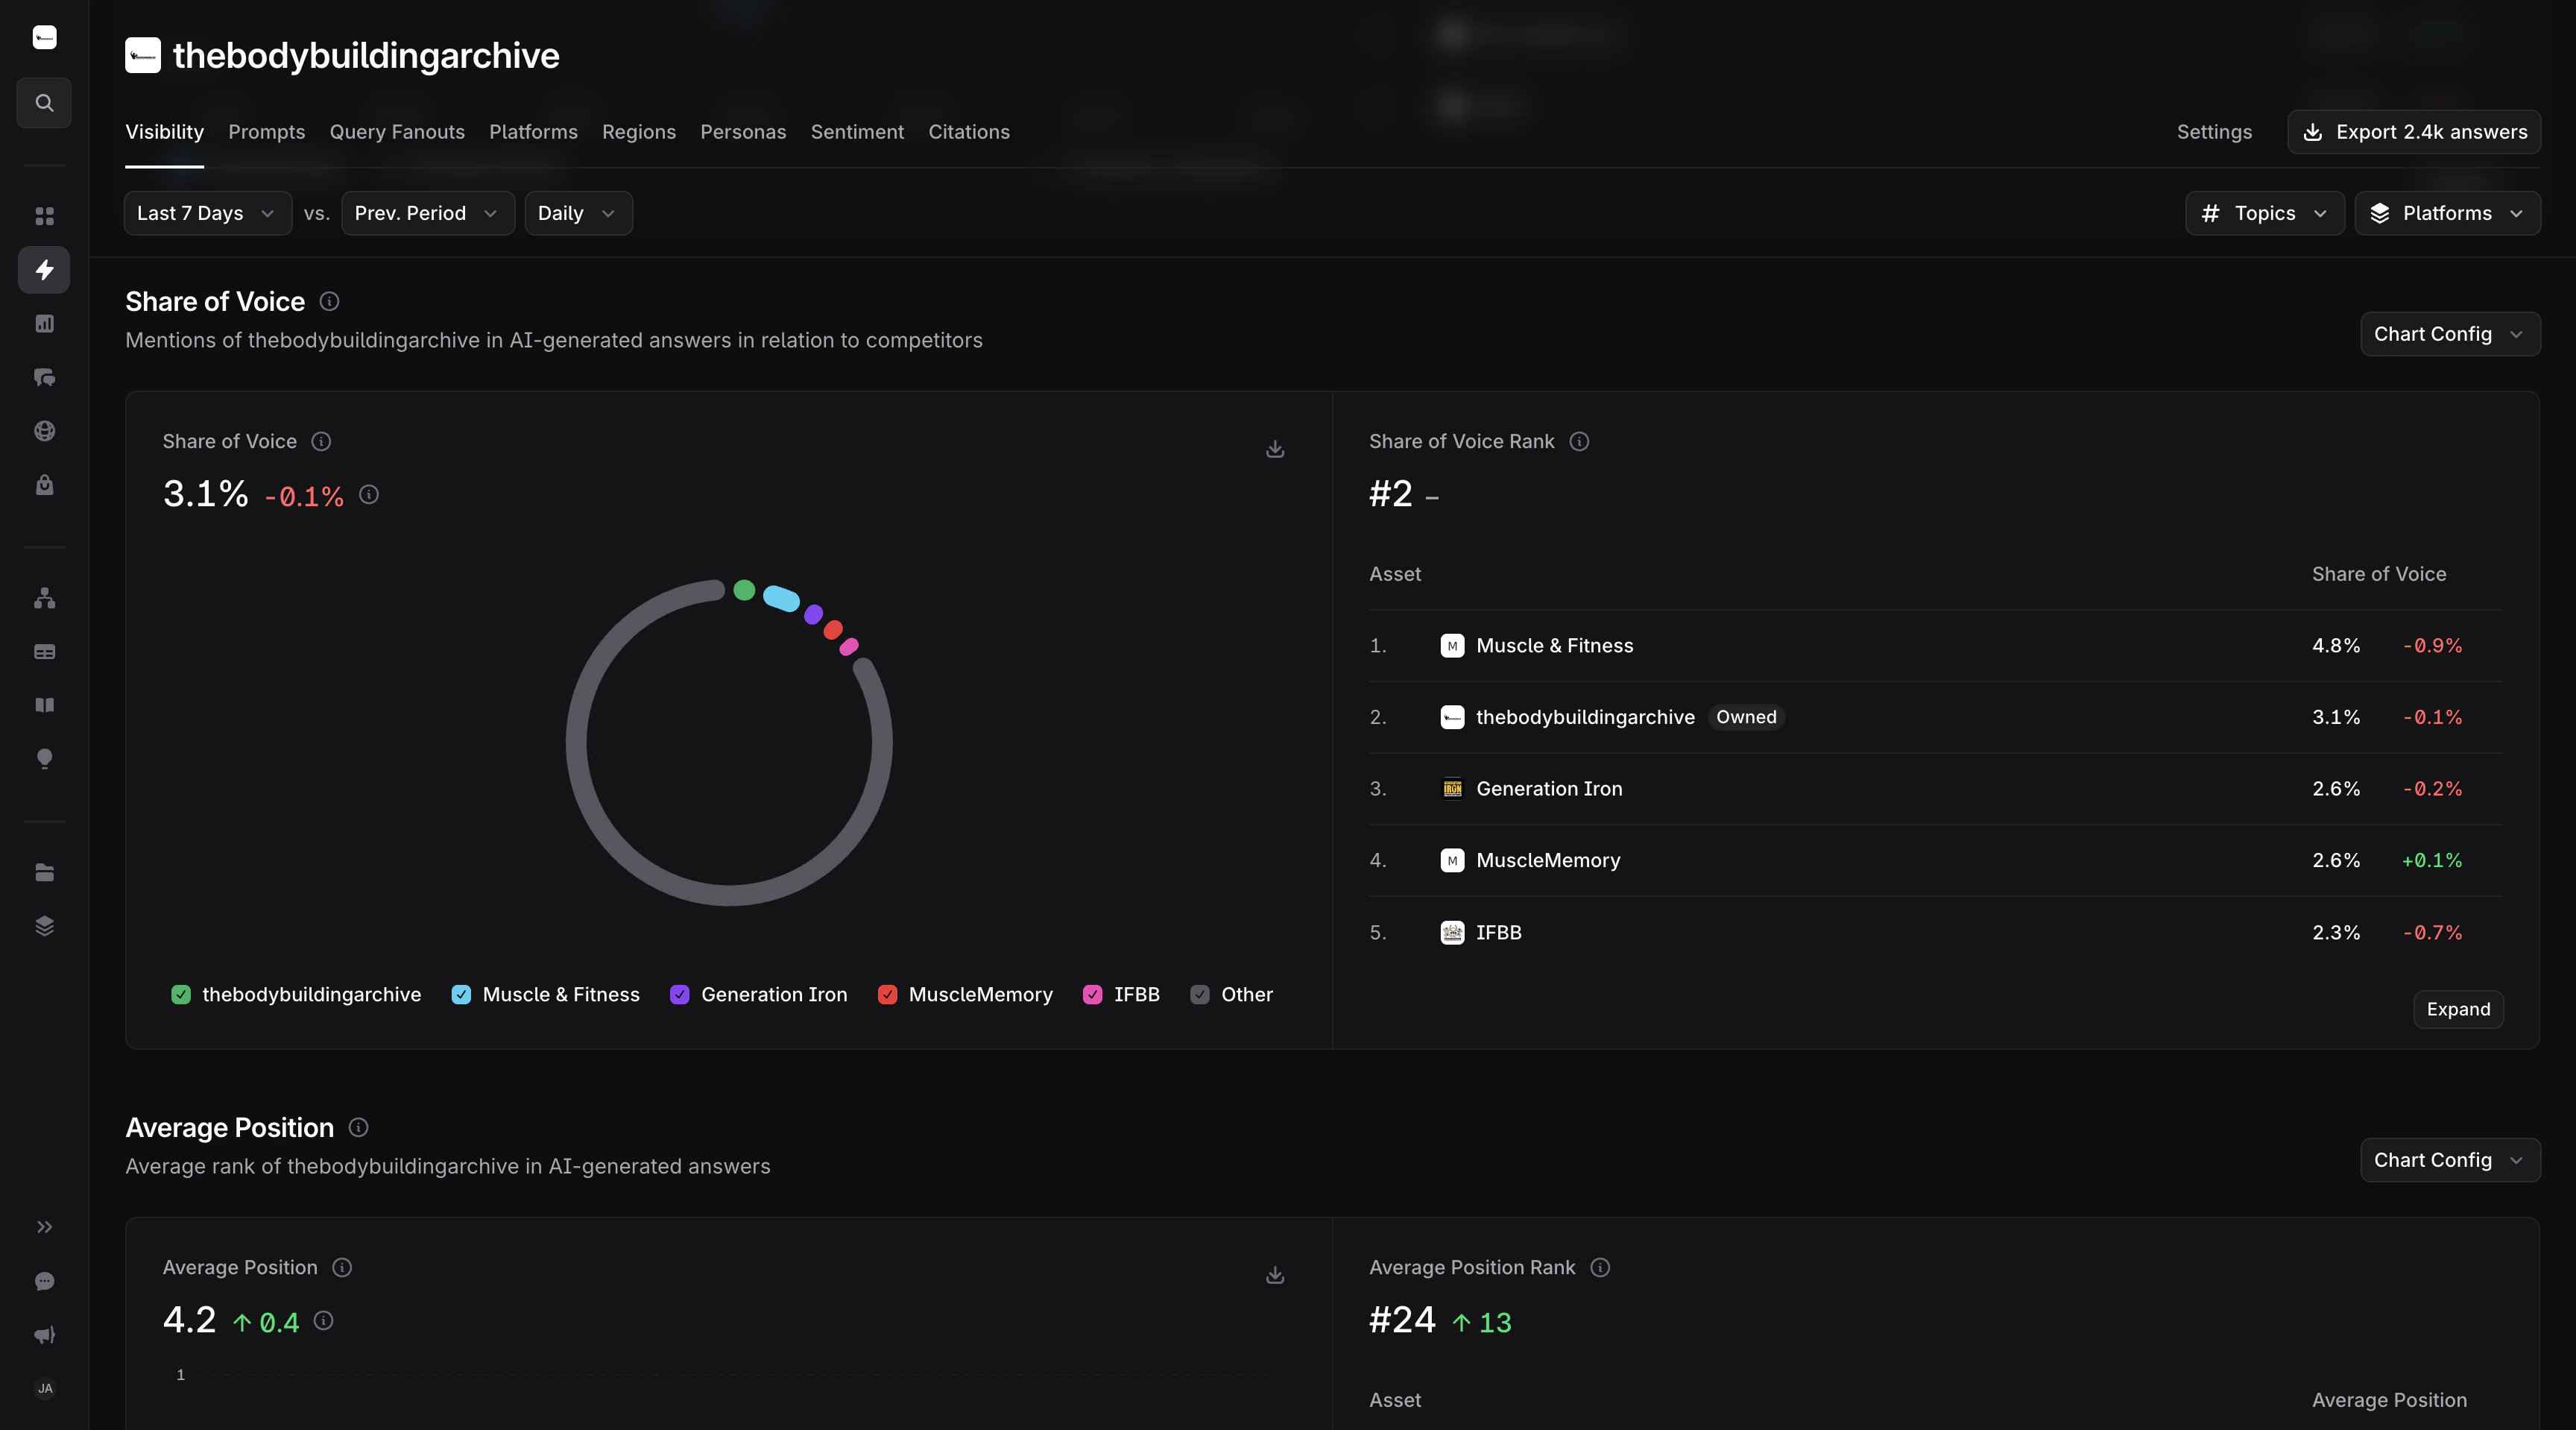
- プラットフォーム別の Share of Voice
- リージョン別の Share of Voice
特定の企業について、プラットフォームごとの Visibility Score と Share of Voice を分析します。ユースケース: プラットフォームごとのパフォーマンスと機会を把握します。
POST /v1/reports/visibility HTTP/1.1
Content-Type: application/json
X-API-Key: your_api_key

{
  "category_id": "your_category_id",
  "start_date": "2026-01-01",
  "end_date": "2026-01-07",
  "metrics": ["visibility_score", "share_of_voice"],
  "dimensions": ["model"],
  "filters": [
    {
      "field": "asset_name",
      "operator": "is",
      "value": "your_company_name"
    }
  ]
}
{
  "info": {},  // removed for brevity
  "data": [
    { "metrics": [0.72, 0.15], "dimensions": ["ChatGPT"] },
    { "metrics": [0.65, 0.12], "dimensions": ["Perplexity"] },
    { "metrics": [0.58, 0.09], "dimensions": ["Gemini"] },
    { "metrics": [0.41, 0.06], "dimensions": ["Claude"] }
  ]
}
特定の企業について、リージョンごとの Visibility Score と Share of Voice を分析します。ユースケース: Visibility Score と Share of Voice における、リージョンごとの強みと弱みを特定します。
POST /v1/reports/visibility HTTP/1.1
Content-Type: application/json
X-API-Key: your_api_key

{
  "category_id": "your_category_id",
  "start_date": "2026-01-01",
  "end_date": "2026-01-07",
  "metrics": ["visibility_score", "share_of_voice"],
  "dimensions": ["region"],
  "filters": [
    {
      "field": "asset_name",
      "operator": "is",
      "value": "your_company_name"
    }
  ]
}
{
  "info": {},  // removed for brevity
  "data": [
    {
      "metrics": [0.85, 0.32],
      "dimensions": ["North America"]
    },
    {
      "metrics": [0.72, 0.28],
      "dimensions": ["Europe"]
    }
  ]
}
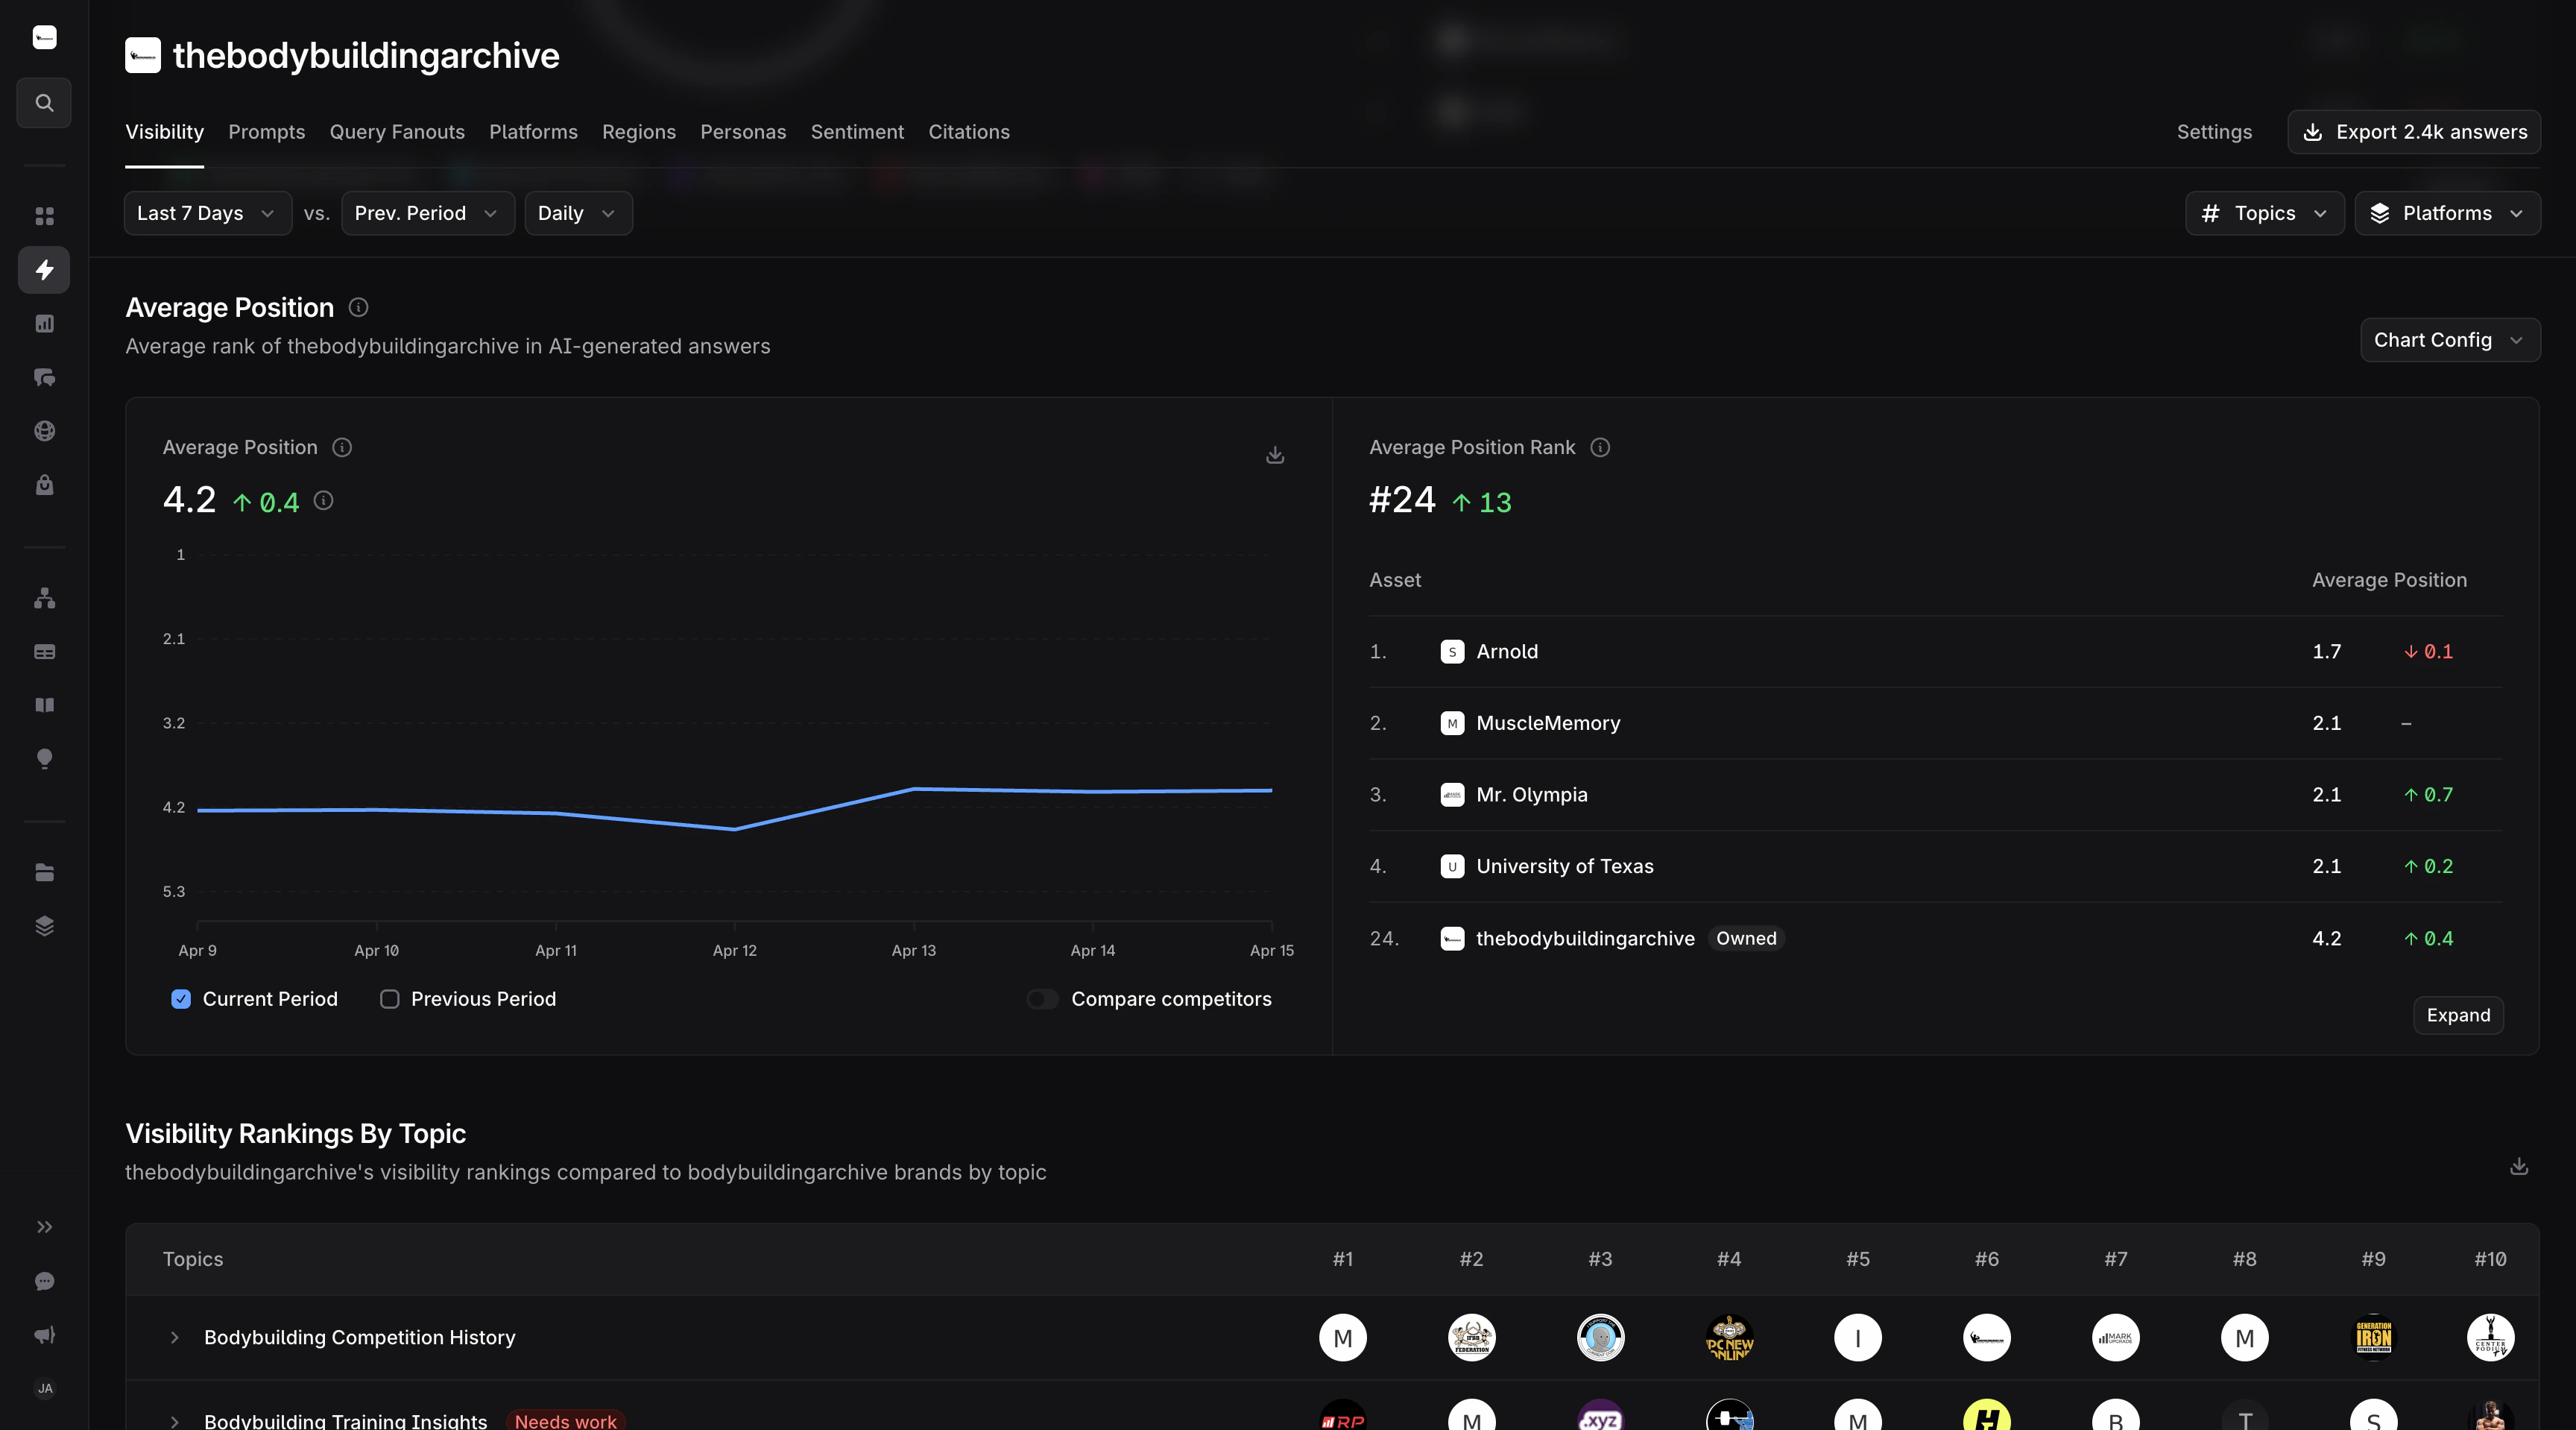
- Average Position 上位の企業
- Average Position の推移
プラットフォームの Average Position ビューを再現するには、2 回の API 呼び出しが必要です。プラットフォームでは、順位で並べ替えたすべてのアセットではなく、可視性で順位付けした上位アセットの平均順位が表示されます。ステップ 1: Visibility Score 上位のアセットを取得します。ステップ 2: それらのアセット名を使用して、平均順位を取得します。ユースケース: 上位にランクインしている企業を特定し、競合他社とベンチマークします。
POST /v1/reports/visibility HTTP/1.1
Content-Type: application/json
X-API-Key: your_api_key

{
  "category_id": "your_category_id",
  "start_date": "2026-01-01",
  "end_date": "2026-01-07",
  "metrics": ["visibility_score"],
  "dimensions": ["asset_name"],
  "order_by": { "visibility_score": "desc" },
  "pagination": { "limit": 50 }
}
POST /v1/reports/visibility HTTP/1.1
Content-Type: application/json
X-API-Key: your_api_key

{
  "category_id": "your_category_id",
  "start_date": "2026-01-01",
  "end_date": "2026-01-07",
  "metrics": ["average_position"],
  "dimensions": ["asset_name"],
  "filters": [
    {
      "field": "asset_name",
      "operator": "in",
      "value": ["Company A", "Company B", "Company C", "Company D", "Company E"]
    }
  ],
  "order_by": { "average_position": "asc" }
}
"asc" の並び順: 順位は低いほど良いため、1 位の値が最も小さくなります。"in" フィルターには、ステップ 1 で返されたアセット名を使用します。{
"info": {}, // removed for brevity
"data": [
{ "metrics": [1.6], "dimensions": ["Company A"] },
{ "metrics": [2.0], "dimensions": ["Company B"] },
{ "metrics": [2.2], "dimensions": ["Company C"] },
{ "metrics": [3.2], "dimensions": ["Company D"] },
{ "metrics": [3.5], "dimensions": ["Company E"] }
]
}
特定の企業の平均順位を日単位の粒度で追跡します。ユースケース: 日々の順位の変化をモニタリングし、トレンドを特定します。
POST /v1/reports/visibility HTTP/1.1
Content-Type: application/json
X-API-Key: your_api_key

{
  "category_id": "your_category_id",
  "start_date": "2026-01-01",
  "end_date": "2026-01-07",
  "date_interval": "day",
  "metrics": ["average_position"],
  "dimensions": ["date"],
  "filters": [
    {
      "field": "asset_name",
      "operator": "is",
      "value": "your_company_name"
    }
  ]
}
{
  "info": {},  // removed for brevity
  "data": [
    { "metrics": [2.5], "dimensions": ["2026-01-01"] },
    { "metrics": [2.3], "dimensions": ["2026-01-02"] },
    { "metrics": [2.1], "dimensions": ["2026-01-03"] },
    { "metrics": [2.0], "dimensions": ["2026-01-04"] },
    { "metrics": [2.2], "dimensions": ["2026-01-05"] },
    { "metrics": [2.4], "dimensions": ["2026-01-06"] },
    { "metrics": [2.2], "dimensions": ["2026-01-07"] }
  ]
}
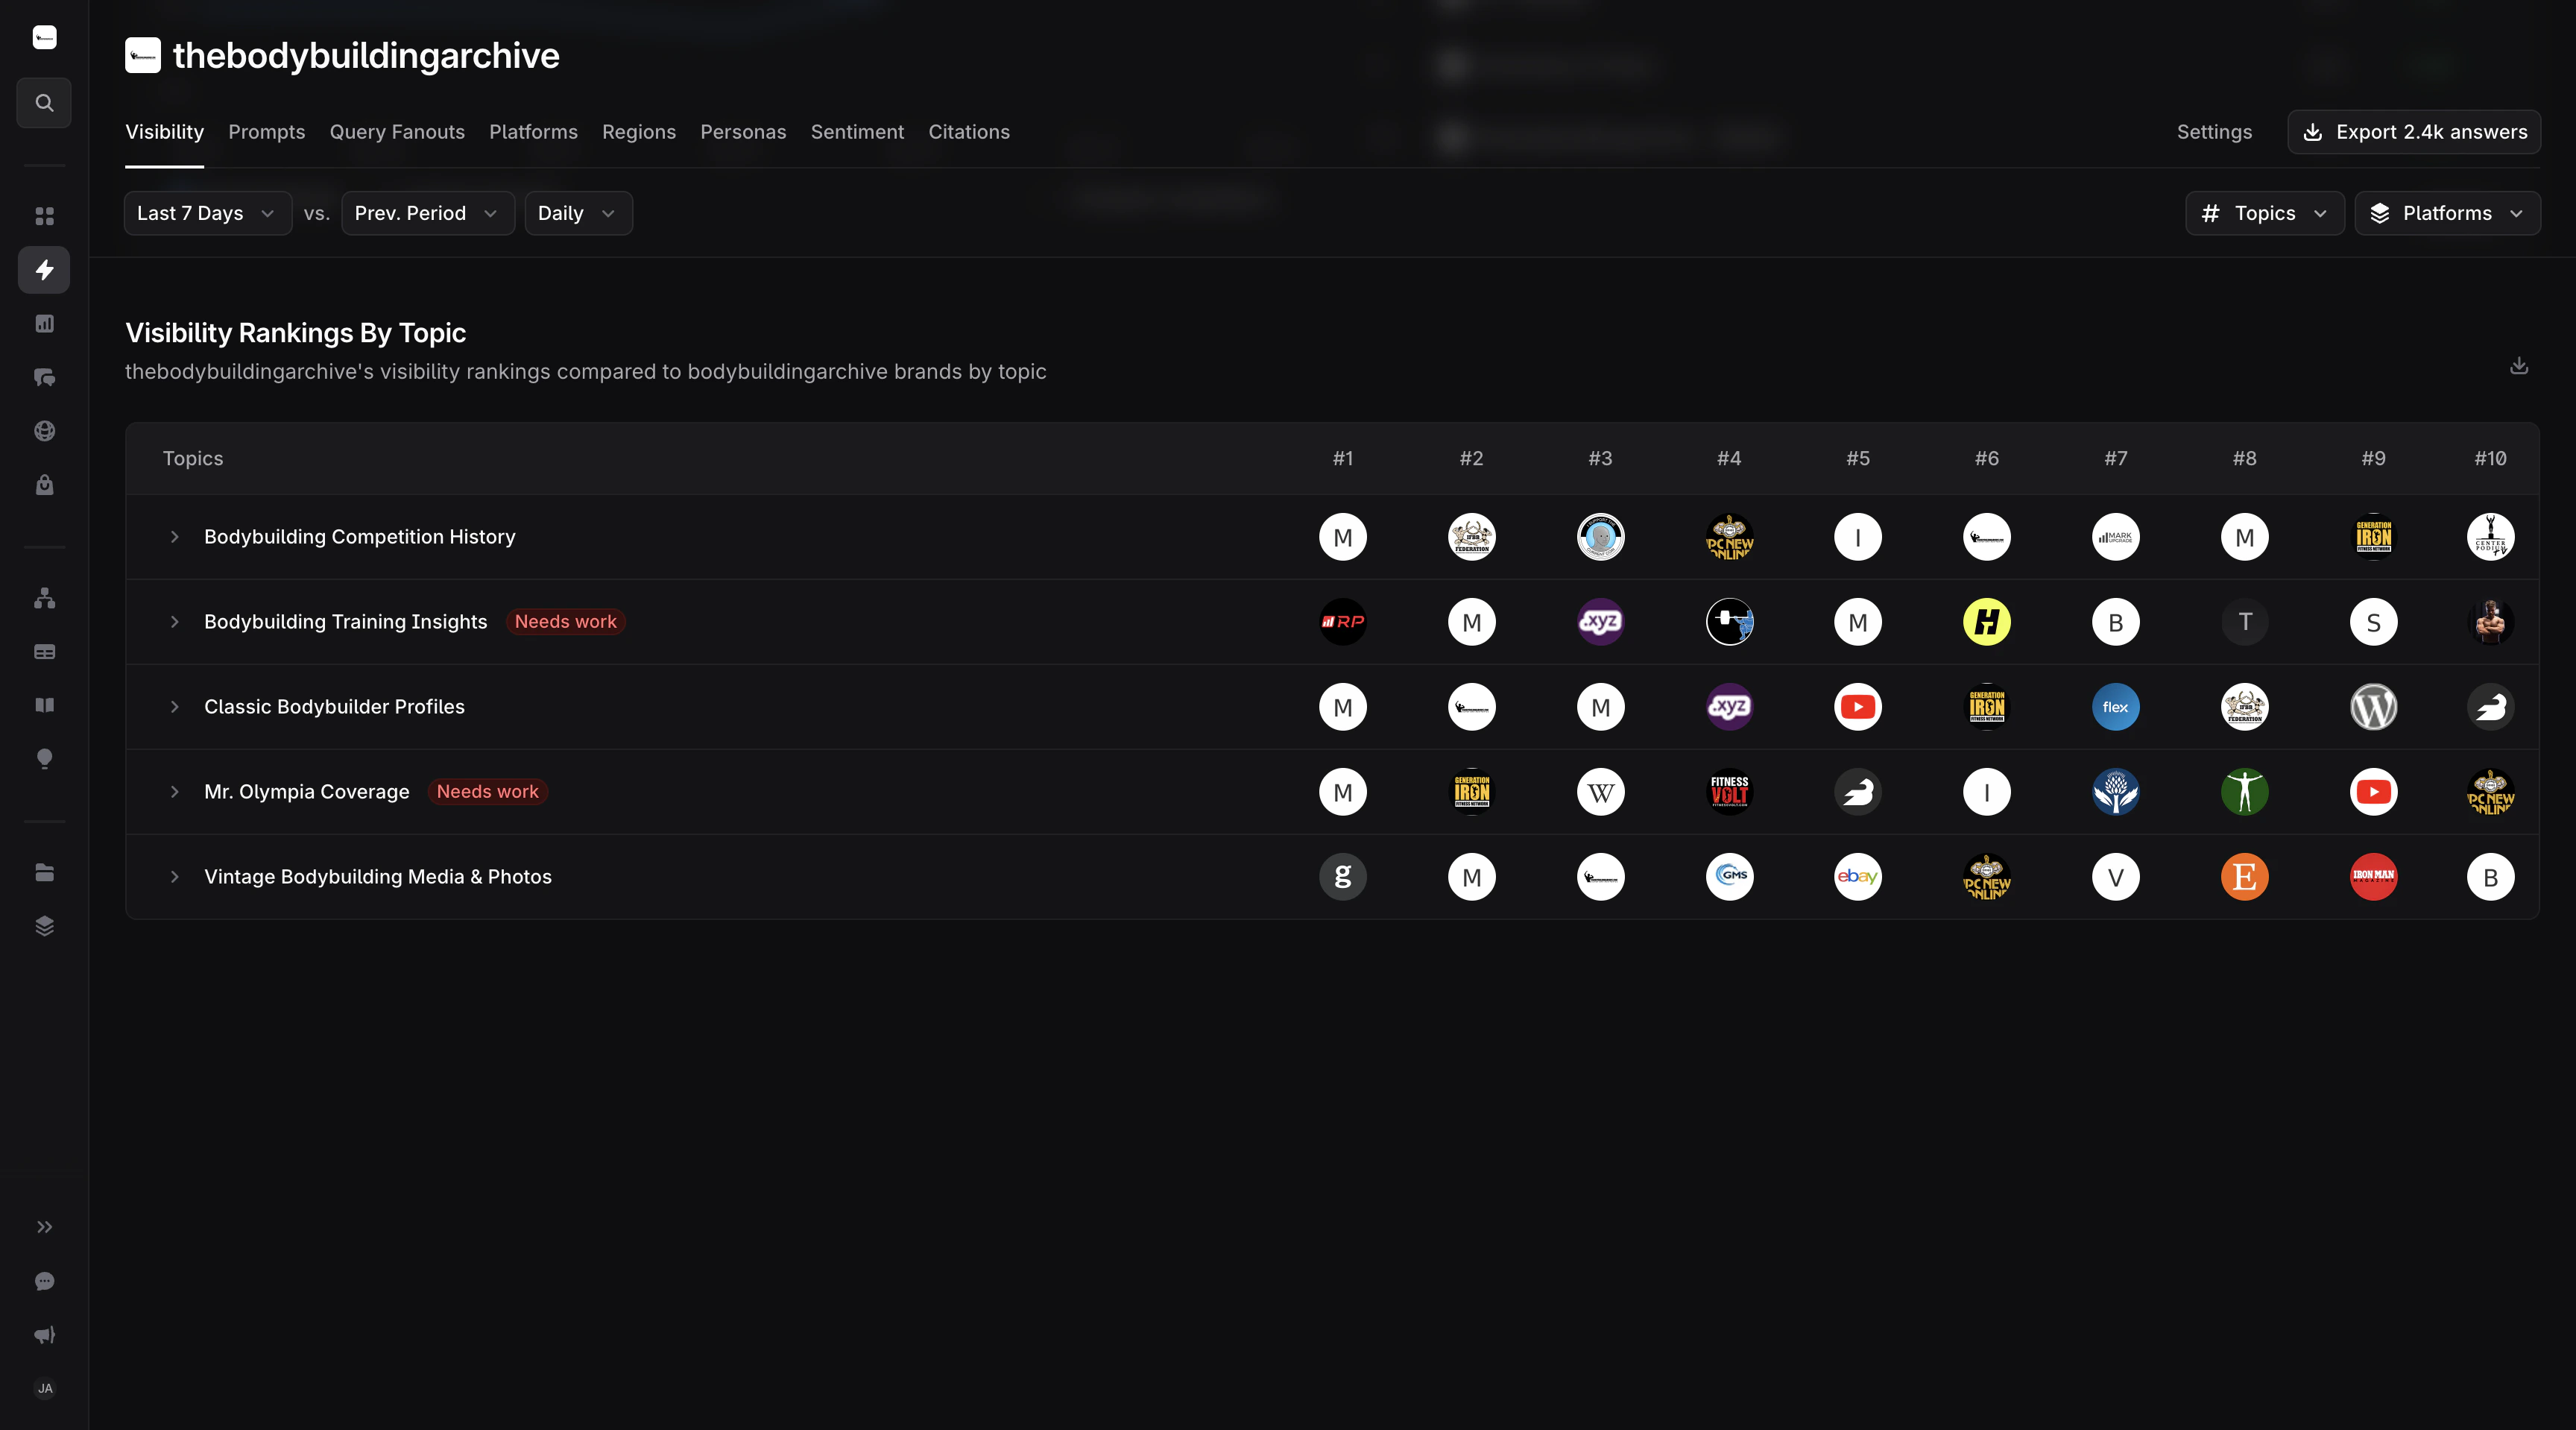
- トピックおよびプロンプト別の可視性
特定の企業について、トピックやプロンプトの種類ごとの Visibility Score と Share of Voice を分析します。ユースケース: 特定の企業について、トピックやプロンプトの種類ごとの Visibility Score と Share of Voice を分析します。
POST /v1/reports/visibility HTTP/1.1
Content-Type: application/json
X-API-Key: your_api_key

{
  "category_id": "your_category_id",
  "start_date": "2026-01-01",
  "end_date": "2026-01-07",
  "metrics": ["visibility_score", "share_of_voice"],
  "dimensions": ["prompt", "topic"],
  "filters": [
    {
      "field": "asset_name",
      "operator": "is",
      "value": "your_company_name"
    }
  ]
}
{
  "info": {},  // removed for brevity
  "data": [
    {
      "metrics": [0.45, 0.88],
      "dimensions": ["What is the best CRM software?", "CRM Software"]
    },
    {
      "metrics": [0.38, 0.75],
      "dimensions": ["Top project management tools for teams", "Project Management"]
    },
    {
      "metrics": [0.30, 0.62],
      "dimensions": ["Best enterprise collaboration platforms", "Collaboration"]
    }
  ]
}
複数のタググループを組み合わせ、独立したディメンションを掛け合わせてカテゴリを分析します。これは、
filters 配列内の各フィルターは結果を絞り込みます。グループ内の OR を表すには、1 つの in フィルターに値を列挙します。グループ間の AND を表すには、同じフィールドに対して複数の in フィルターを送信します。POST /v1/reports/visibility HTTP/1.1
Content-Type: application/json
X-API-Key: your_api_key
{
"category_id": "your_category_id",
"start_date": "2026-01-01",
"end_date": "2026-01-07",
"metrics": ["share_of_voice"],
"dimensions": ["asset_name"],
"filters": [
{
"field": "tag_id",
"operator": "in",
"value": [
"tag_id_product_a",
"tag_id_product_b",
"tag_id_product_c"
]
},
{
"field": "tag_id",
"operator": "in",
"value": ["tag_id_product_d"]
}
]
}
product_a、product_b、product_c のいずれか 1 つ以上のタグが付いており、かつ tag_id_product_d のタグも付いているプロンプトに一致します。同等のブール式: (product_a OR product_b OR product_c) AND tag_id_product_d。4 つのタグ ID すべてを 1 つの
in フィルターに列挙すると、「これら 4 つのいずれか」という意味になります。
(product_a OR product_b OR product_c OR tag_id_product_d)センチメント分析
企業やトピックをまたいで、センチメントデータと感情的な反応を分析します。利用可能なすべての指標、ディメンション、フィルターについては、エンドポイントリファレンス を参照してください。可視性レポート の AND/OR を組み合わせたタグフィルタリング タブで紹介したフィルターの組み合わせは、このエンドポイントでも使用できます。
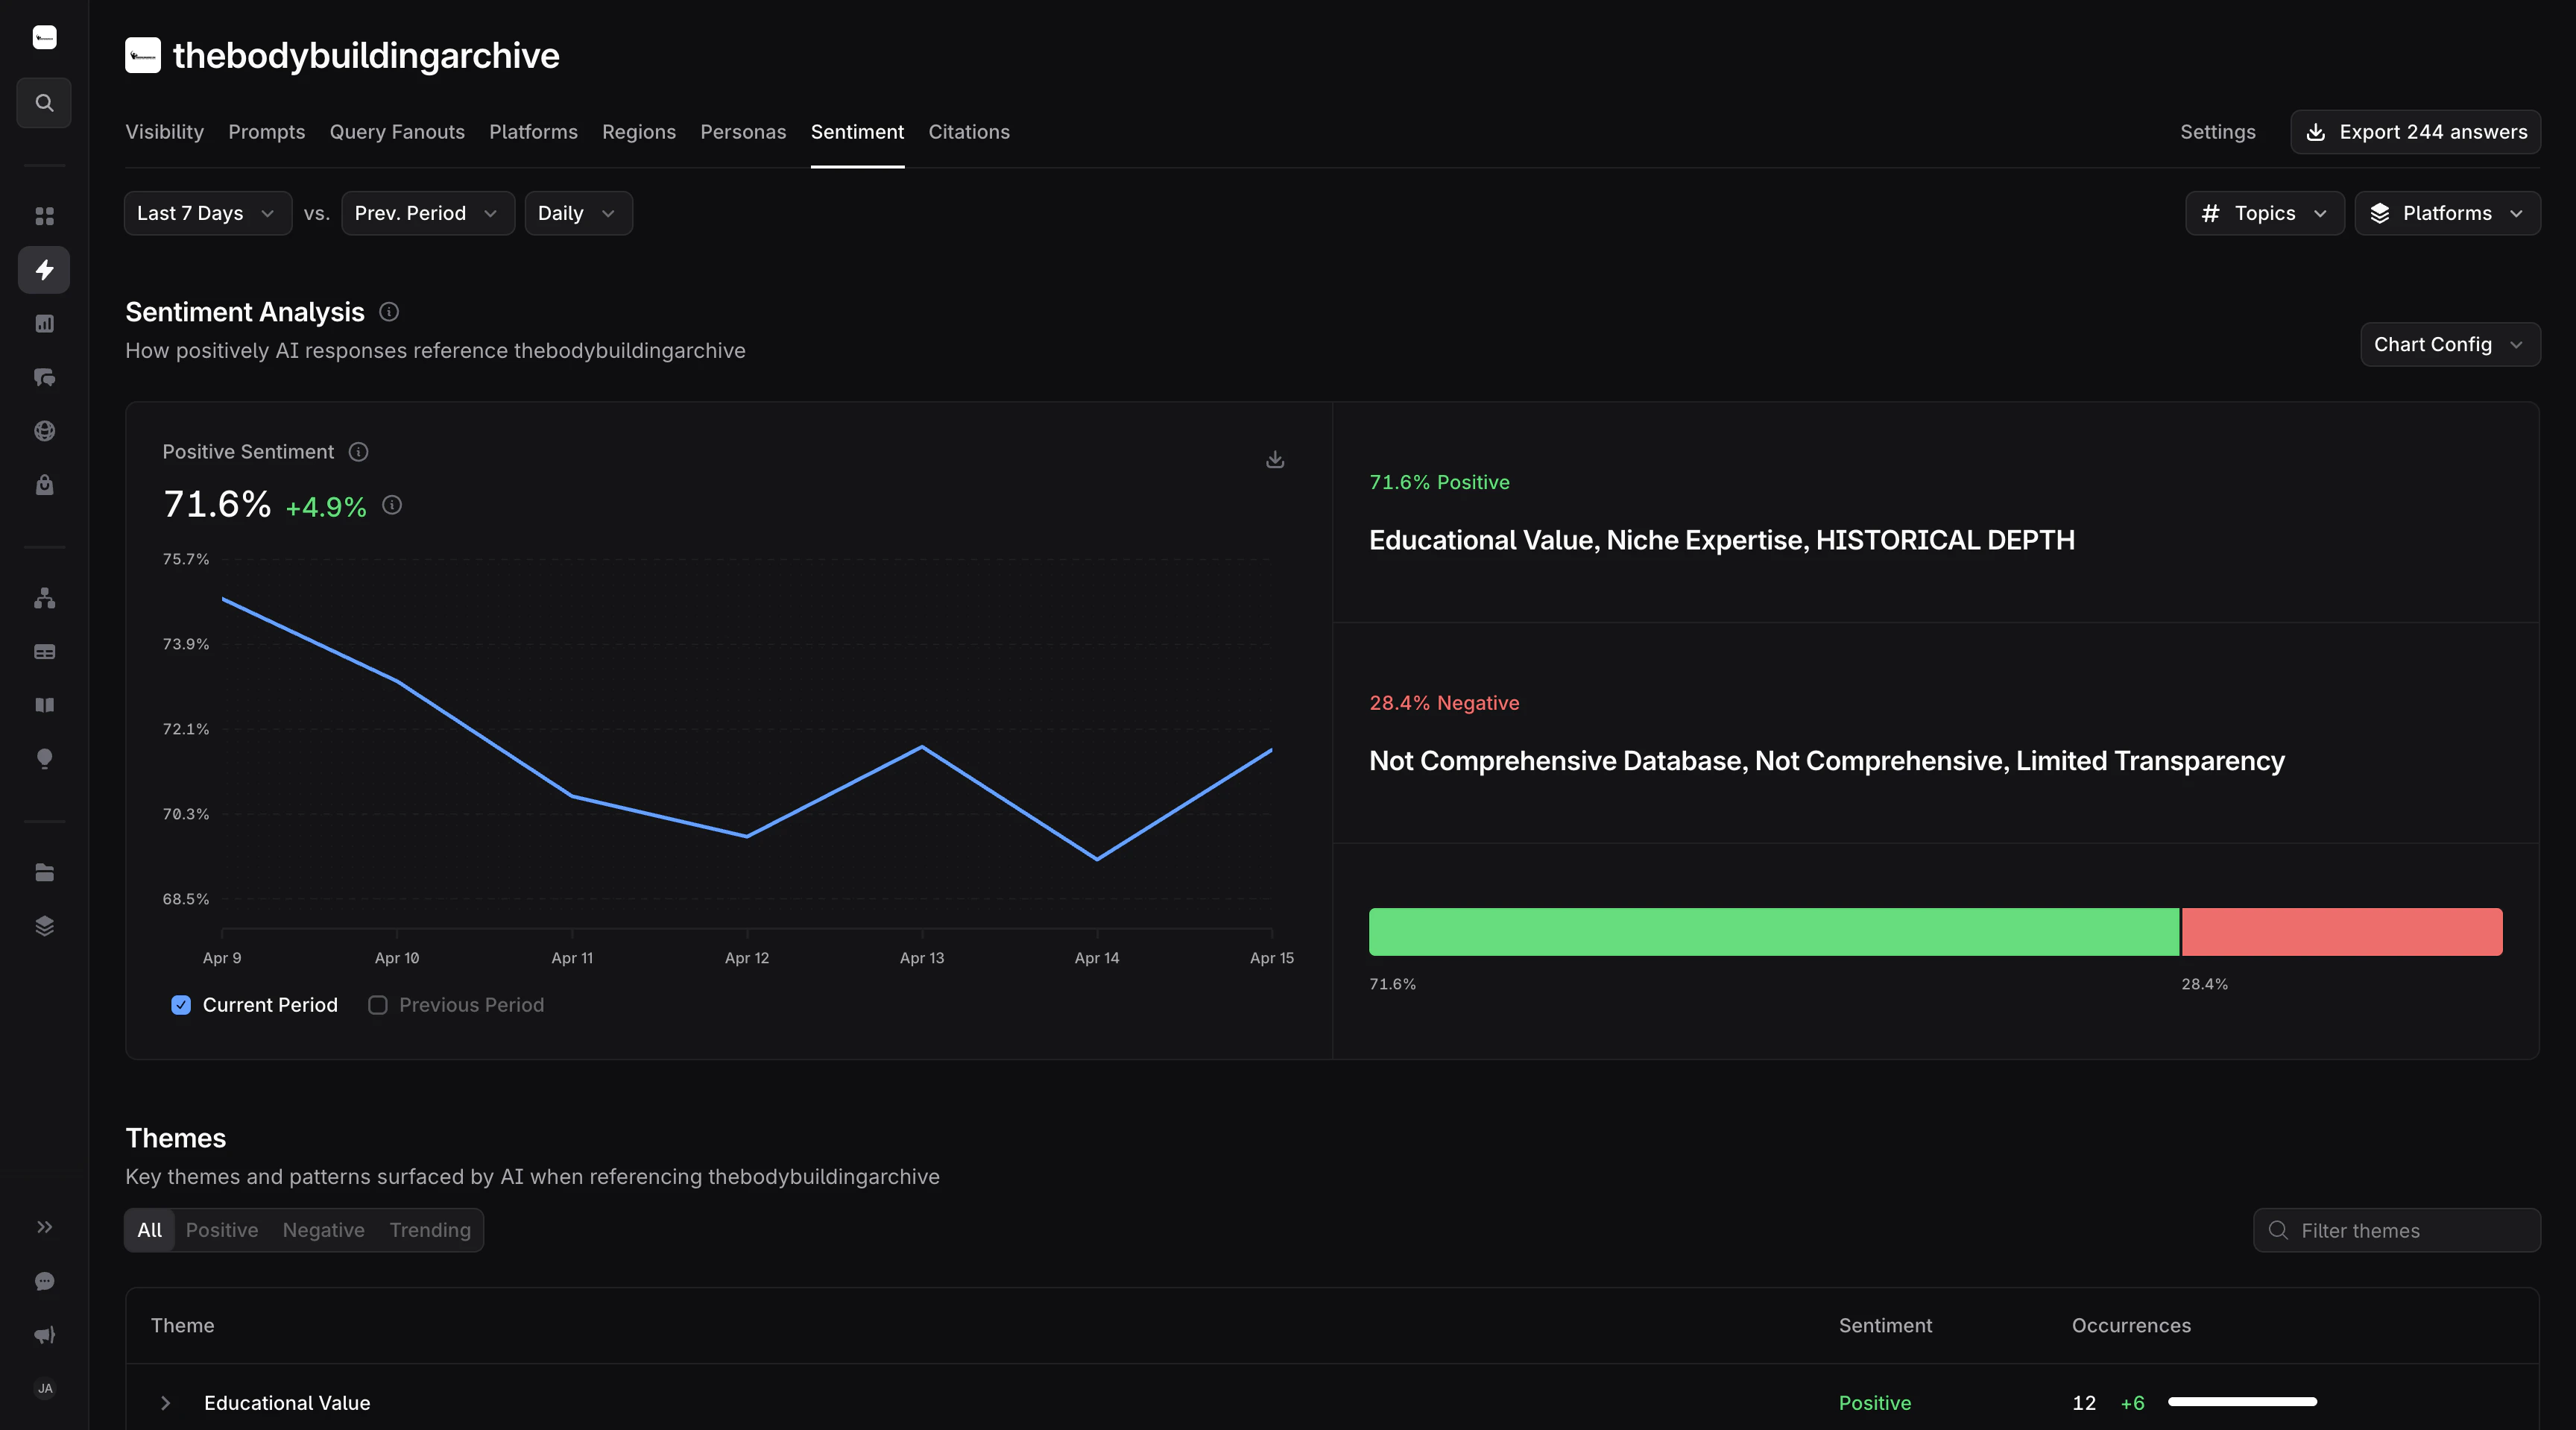
- ポジティブセンチメント上位 5 社
- テーマ別の企業センチメント
POST /v1/reports/sentiment HTTP/1.1
Content-Type: application/json
X-API-Key: your_api_key

{
  "category_id": "your_category_id",
  "start_date": "2026-01-01",
  "end_date": "2026-01-07",
  "metrics": ["positive"],
  "dimensions": ["asset_name"],
  "pagination": { "limit": 5 }
}
{
  "info": {},  // removed for brevity
  "data": [
    { "metrics": [2413], "dimensions": ["Company A"] },
    { "metrics": [1856], "dimensions": ["Company B"] },
    { "metrics": [1204], "dimensions": ["Company C"] },
    { "metrics": [987], "dimensions": ["Company D"] },
    { "metrics": [714], "dimensions": ["Company E"] }
  ]
}
センチメントの指標は、可視性のような割合ではなく整数のカウントです。
positive = そのアセットに対するポジティブなセンチメントの件数です。利用可能なセンチメントの指標: positive、negative、occurrences(合計件数)。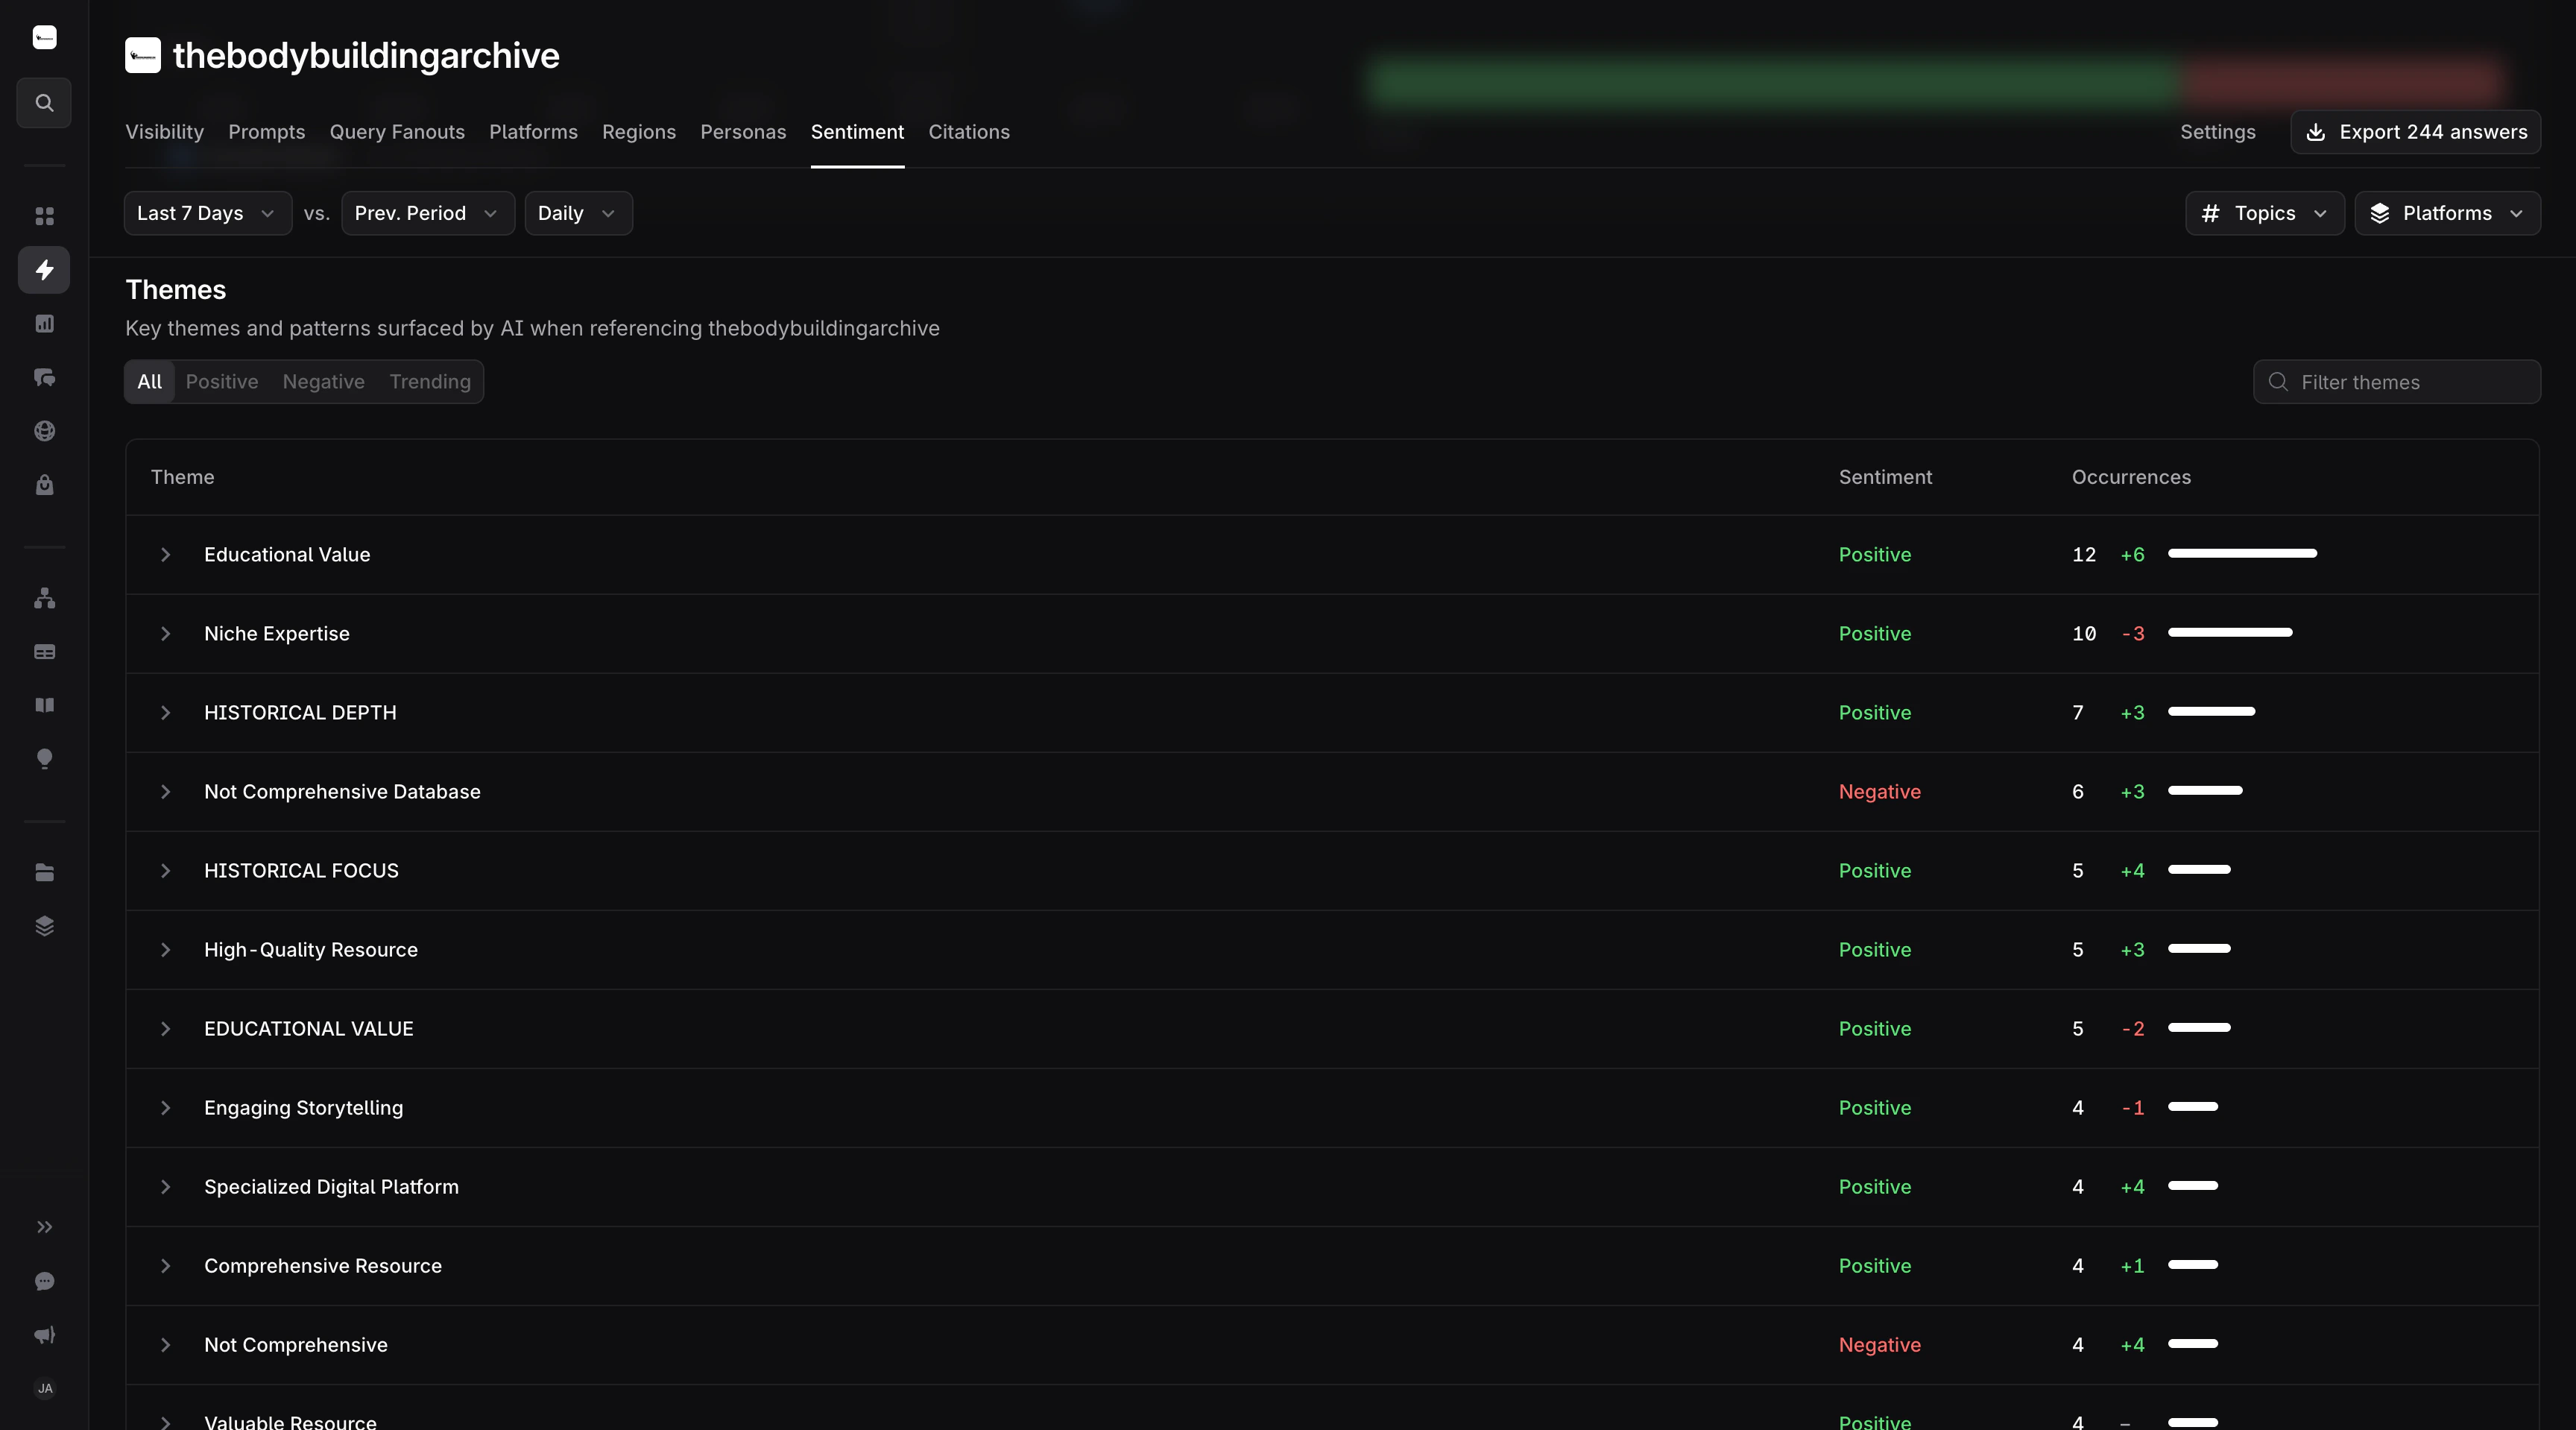
POST /v1/reports/sentiment HTTP/1.1
Content-Type: application/json
X-API-Key: your_api_key

{
  "category_id": "your_category_id",
  "start_date": "2026-01-01",
  "end_date": "2026-01-07",
  "metrics": ["positive", "negative"],
  "dimensions": ["theme"],
  "pagination": {
    "limit": 5
  },
  "filters": [
    {
      "field": "asset_name",
      "operator": "is",
      "value": "your_company_name"
    }
  ]
}
{
  "info": {},  // removed for brevity
  "data": [
    {
      "metrics": [12, 45],
      "dimensions": ["Customer Support"]
    },
    {
      "metrics": [8, 32],
      "dimensions": ["Pricing"]
    },
    {
      "metrics": [6, 28],
      "dimensions": ["Ease of Use"]
    },
    {
      "metrics": [4, 50],
      "dimensions": ["Product Quality"]
    },
    {
      "metrics": [2, 18],
      "dimensions": ["Integration"]
    }
  ]
}
引用レポート
ドメインやページをまたいで、言及、参照、引用のパターンを追跡します。利用可能なすべての指標、ディメンション、フィルターについては、エンドポイントリファレンス を参照してください。可視性レポート の AND/OR を組み合わせたタグフィルタリング タブで紹介したフィルターの組み合わせは、このエンドポイントでも使用できます。
- Citation Share
- 引用カテゴリとドメイン
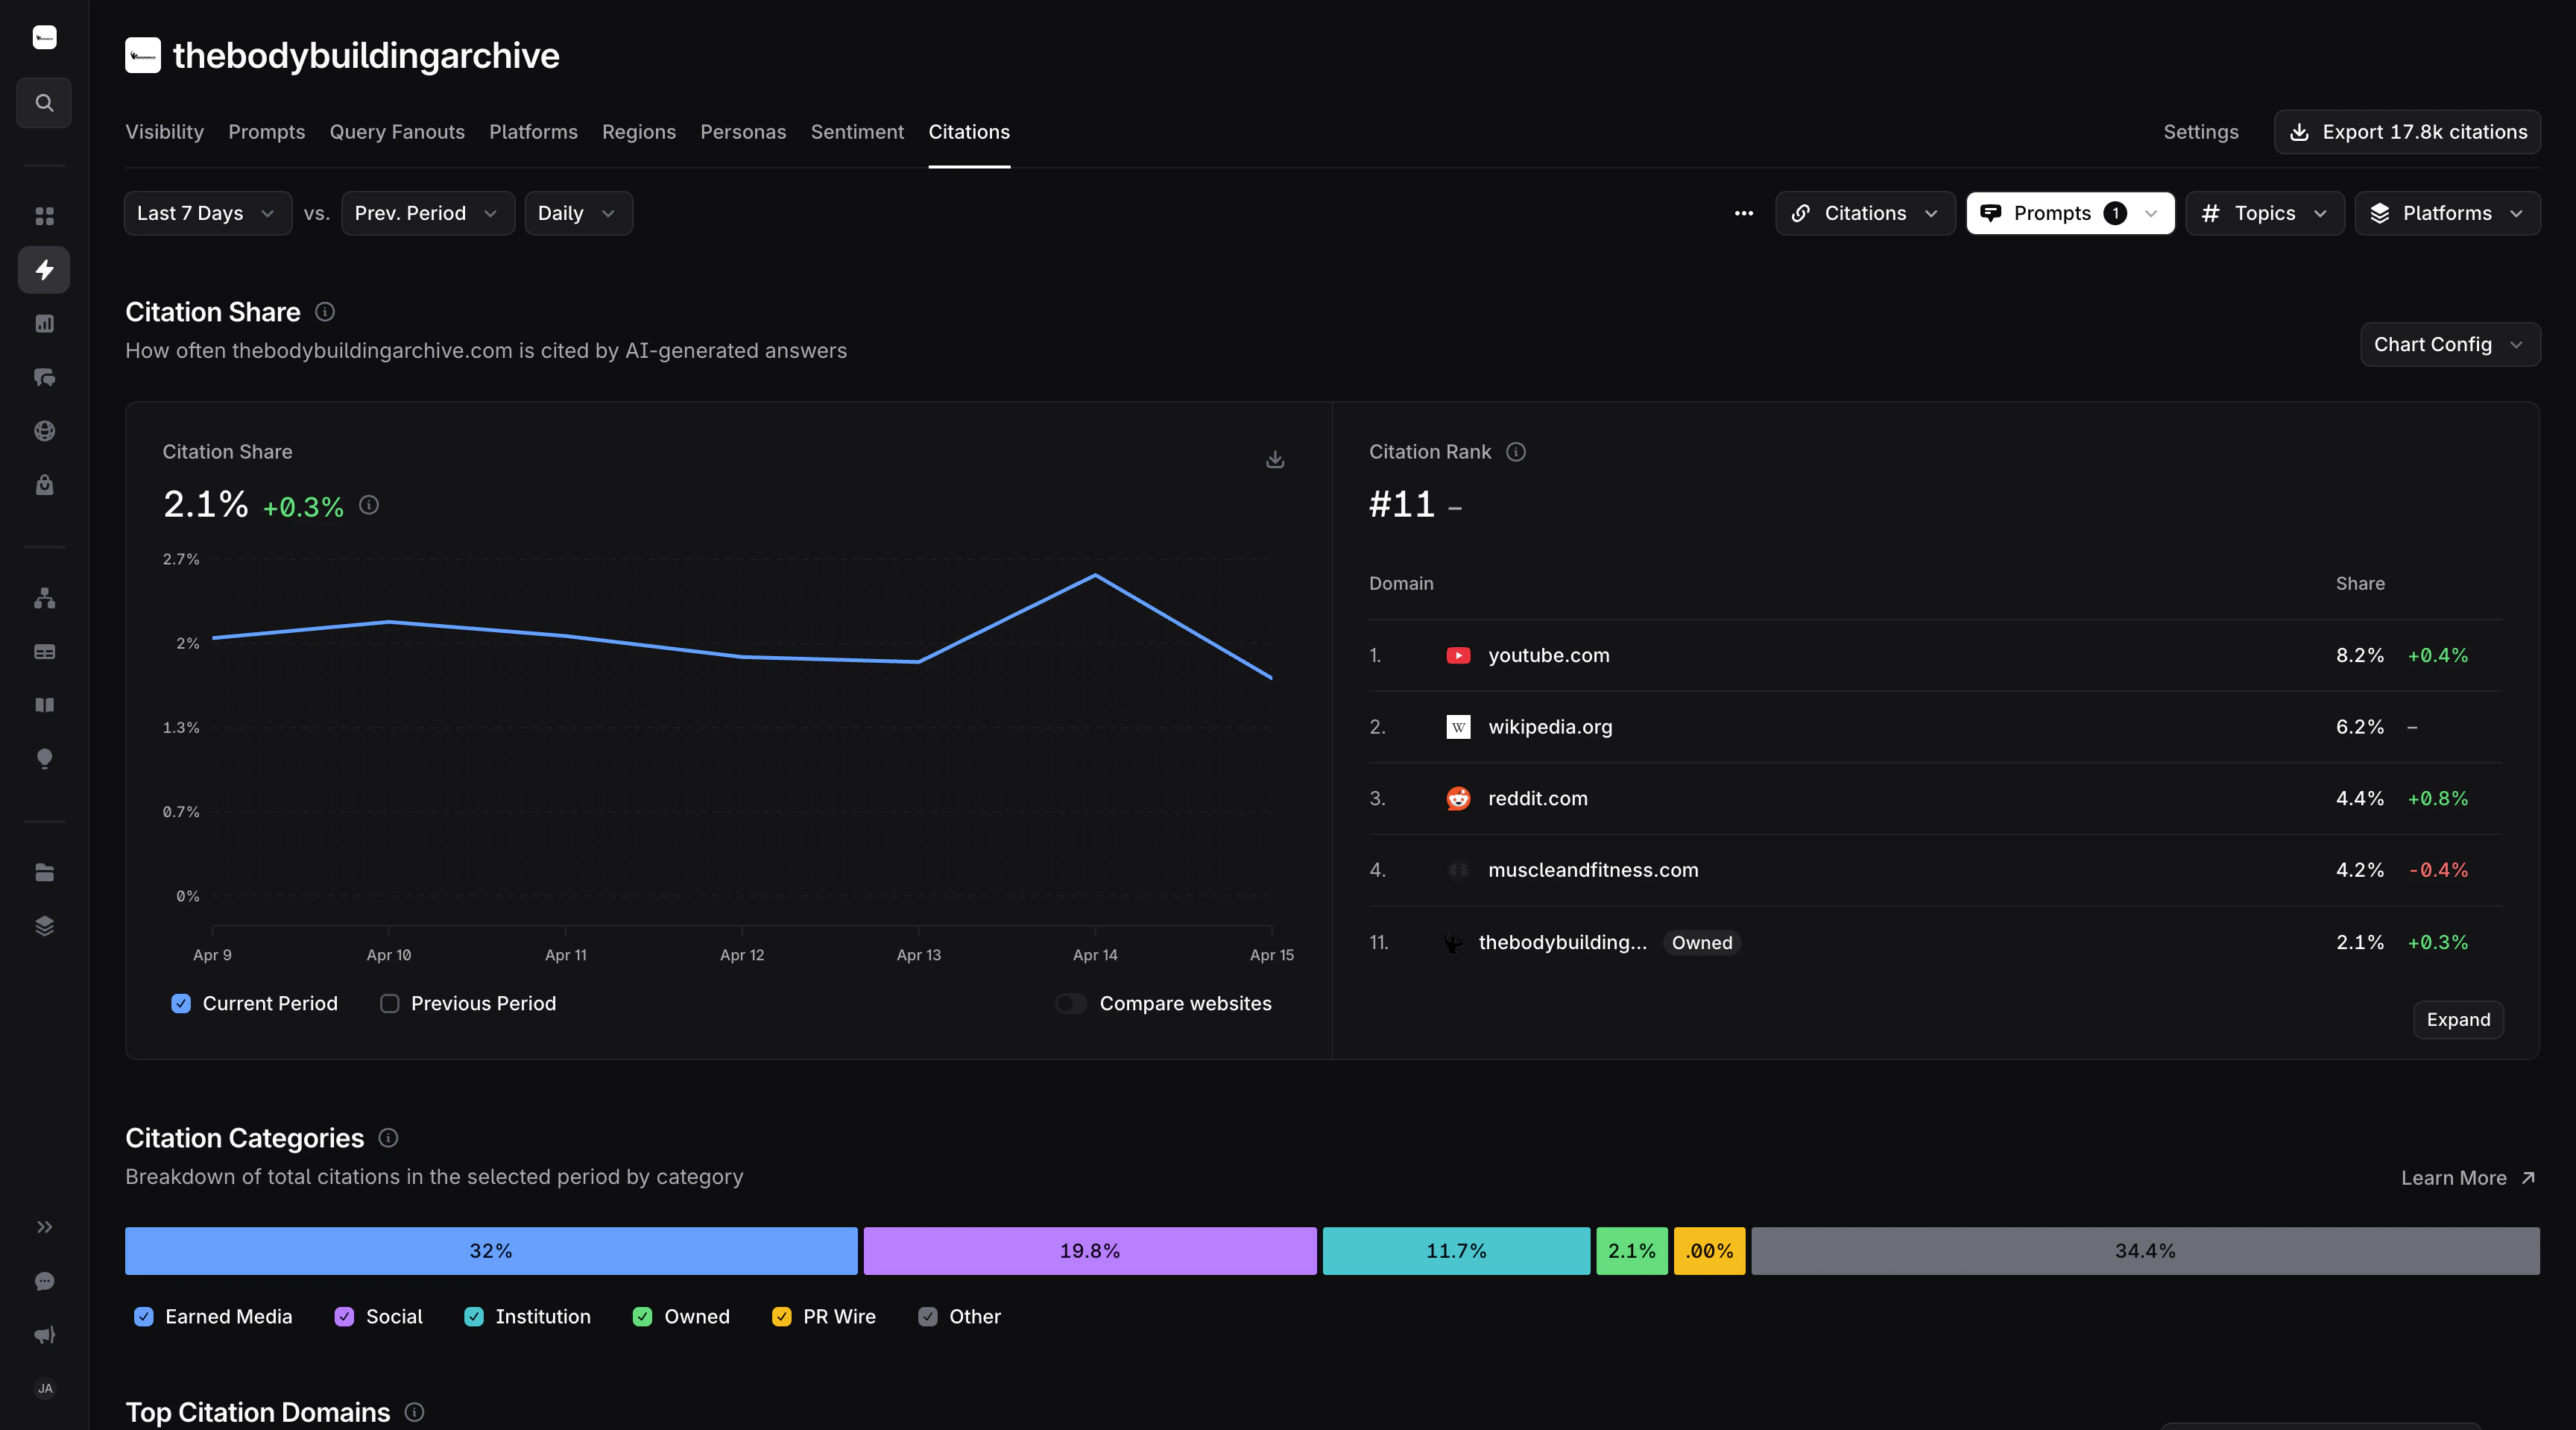
- Citation Share の推移
- Citation Share 上位 5 ドメイン
ドメインごとの引用シェアを日単位の粒度で追跡します。ユースケース: 競合するドメイン間で、引用シェアが時間とともにどのように推移するかをモニタリングします。
POST /v1/reports/citations HTTP/1.1
Content-Type: application/json
X-API-Key: your_api_key

{
  "category_id": "your_category_id",
  "start_date": "2026-04-08",
  "end_date": "2026-04-15",
  "metrics": ["citation_share"],
  "dimensions": ["date", "hostname"],
  "date_interval": "day",
  "order_by": { "date": "asc" }
}
{
  "info": {},  // removed for brevity
  "data": [
    { "metrics": [0.092], "dimensions": ["2026-04-08 00:00:00", "example-a.com"] },
    { "metrics": [0.028], "dimensions": ["2026-04-08 00:00:00", "example-b.com"] },
    { "metrics": [0.021], "dimensions": ["2026-04-08 00:00:00", "example-c.com"] },
    { "metrics": [0.018], "dimensions": ["2026-04-08 00:00:00", "example-d.com"] },
    { "metrics": [0.015], "dimensions": ["2026-04-08 00:00:00", "example-e.com"] },
    { "metrics": [0.105], "dimensions": ["2026-04-09 00:00:00", "example-a.com"] },
    { "metrics": [0.030], "dimensions": ["2026-04-09 00:00:00", "example-b.com"] },
    { "metrics": [0.024], "dimensions": ["2026-04-09 00:00:00", "example-c.com"] },
    { "metrics": [0.019], "dimensions": ["2026-04-09 00:00:00", "example-d.com"] },
    { "metrics": [0.013], "dimensions": ["2026-04-09 00:00:00", "example-e.com"] },
    { "metrics": [0.088], "dimensions": ["2026-04-10 00:00:00", "example-a.com"] },
    { "metrics": [0.026], "dimensions": ["2026-04-10 00:00:00", "example-b.com"] }
  ]
}
引用シェアで順位付けした上位 5 ドメインを、引用の合計数とともに取得します。ユースケース: カテゴリ内で最も引用されているドメインと、その相対的なシェアを特定します。
POST /v1/reports/citations HTTP/1.1
Content-Type: application/json
X-API-Key: your_api_key

{
  "category_id": "your_category_id",
  "start_date": "2026-04-08",
  "end_date": "2026-04-15",
  "metrics": ["citation_share", "count"],
  "dimensions": ["hostname"],
  "order_by": { "citation_share": "desc" },
  "pagination": { "limit": 5 }
}
{
  "info": {},  // removed for brevity
  "data": [
    { "metrics": [0.087, 358], "dimensions": ["example-a.com"] },
    { "metrics": [0.025, 102], "dimensions": ["example-b.com"] },
    { "metrics": [0.023, 95], "dimensions": ["example-c.com"] },
    { "metrics": [0.019, 78], "dimensions": ["example-d.com"] },
    { "metrics": [0.015, 61], "dimensions": ["example-e.com"] }
  ]
}
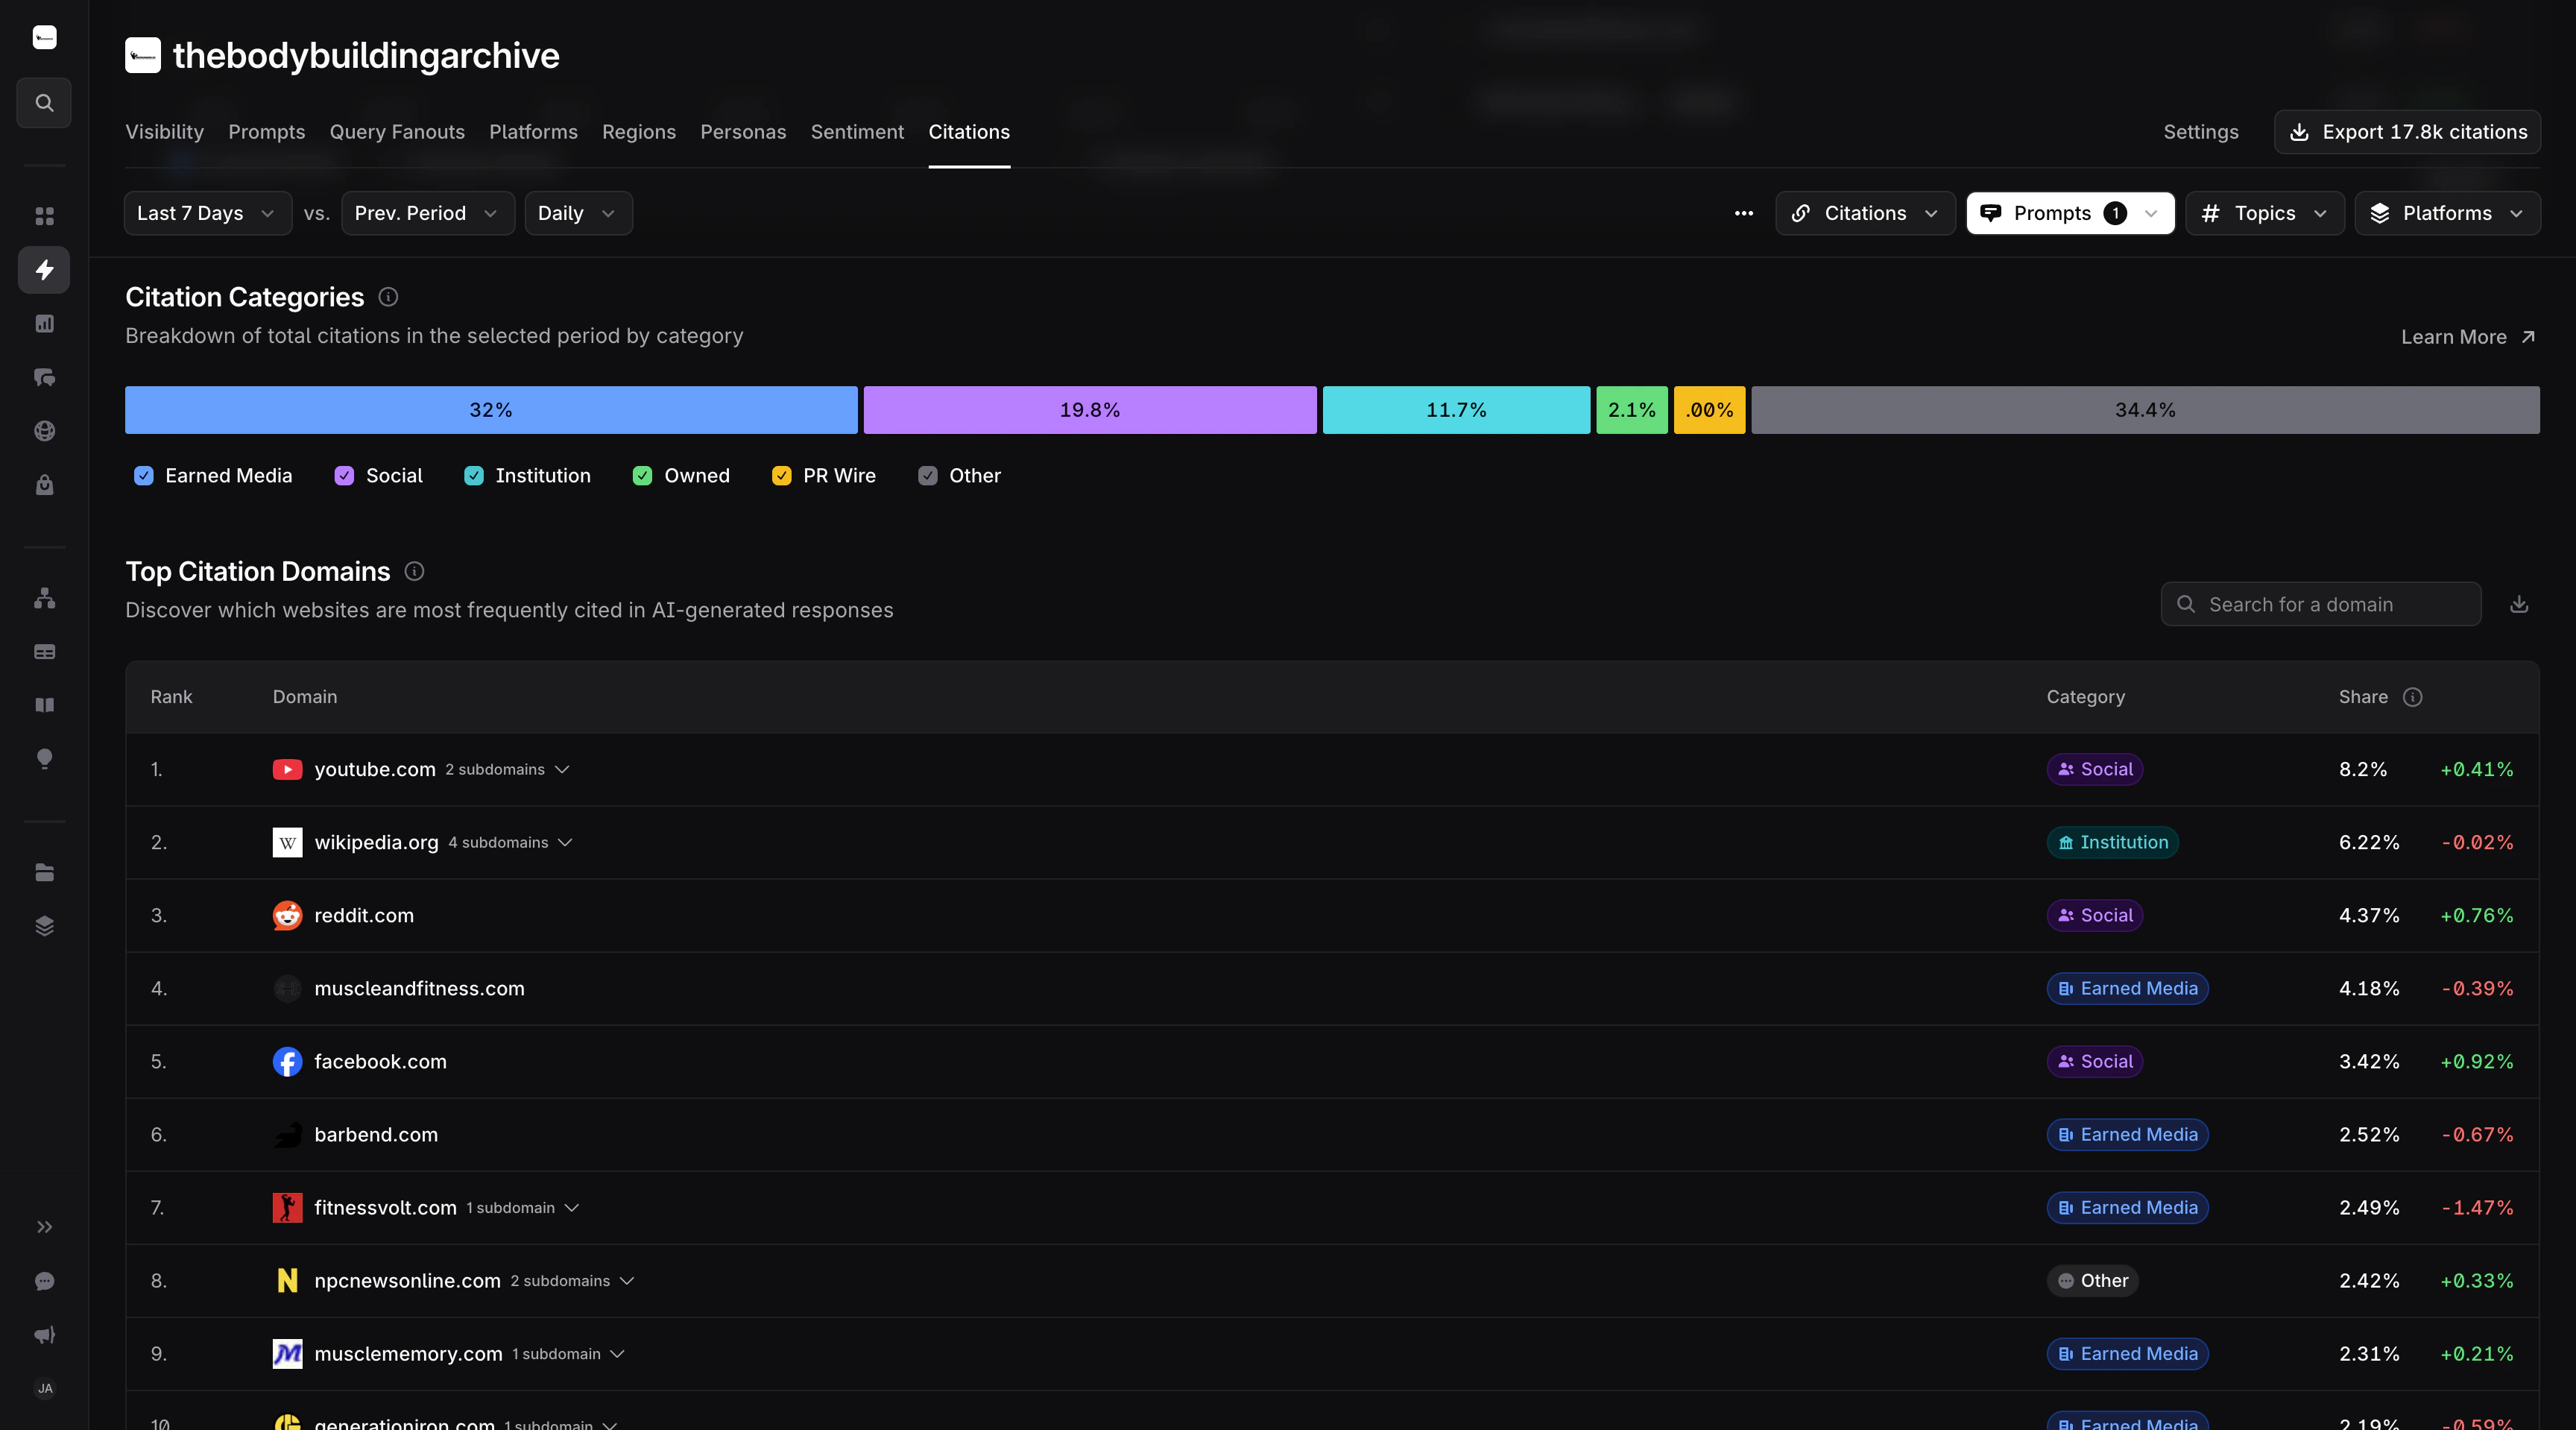
- 引用カテゴリ
- 引用ドメイン上位 10 件
引用カテゴリ別に、引用シェアと引用数を取得します。ユースケース: カテゴリ内で最も多くの言及を生み出している引用カテゴリを把握します。
POST /v1/reports/citations HTTP/1.1
Content-Type: application/json
X-API-Key: your_api_key

{
  "category_id": "your_category_id",
  "start_date": "2026-04-08",
  "end_date": "2026-04-15",
  "metrics": ["citation_share", "count"],
  "dimensions": ["citation_category"],
  "order_by": { "citation_share": "desc" }
}
{
  "info": {},  // removed for brevity
  "data": [
    { "metrics": [0.136, 542], "dimensions": ["Earned Media"] },
    { "metrics": [0.115, 458], "dimensions": ["Social"] },
    { "metrics": [0.079, 315], "dimensions": ["Owned"] },
    { "metrics": [0.053, 211], "dimensions": ["Competition"] },
    { "metrics": [0.034, 136], "dimensions": ["Blog"] },
    { "metrics": [0.028, 112], "dimensions": ["Partner"] },
    { "metrics": [0.024, 96], "dimensions": ["Distribution"] },
    { "metrics": [0.020, 80], "dimensions": ["Documentation"] },
    { "metrics": [0.016, 64], "dimensions": ["Press"] },
    { "metrics": [0.012, 48], "dimensions": ["Video"] },
    { "metrics": [0.010, 40], "dimensions": ["other"] }
  ]
}
引用シェアと引用数に基づく上位 10 の引用ドメインを、引用カテゴリ別にグループ化して取得します。ユースケース: 最も引用されている上位 10 ドメインと、それぞれが属する引用カテゴリを特定します。
POST /v1/reports/citations HTTP/1.1
Content-Type: application/json
X-API-Key: your_api_key

{
  "category_id": "your_category_id",
  "start_date": "2026-04-08",
  "end_date": "2026-04-15",
  "metrics": ["citation_share", "count"],
  "dimensions": ["citation_category", "hostname"],
  "order_by": { "citation_share": "desc" },
  "pagination": { "limit": 10 }
}
{
  "info": {},  // removed for brevity
  "data": [
    { "metrics": [0.038, 152], "dimensions": ["Earned Media", "example-a.com"] },
    { "metrics": [0.035, 140], "dimensions": ["Social", "example-f.com"] },
    { "metrics": [0.028, 112], "dimensions": ["Earned Media", "example-b.com"] },
    { "metrics": [0.025, 100], "dimensions": ["Earned Media", "example-c.com"] },
    { "metrics": [0.024, 96], "dimensions": ["Social", "example-g.com"] },
    { "metrics": [0.021, 84], "dimensions": ["other", "example-d.com"] },
    { "metrics": [0.018, 72], "dimensions": ["Social", "example-h.com"] },
    { "metrics": [0.015, 60], "dimensions": ["Earned Media", "example-e.com"] }
  ]
}
Raw データへのアクセス
カスタム分析のために、未加工のプロンプトおよび回答データにアクセスします。利用可能なすべてのパラメーターとフィルターについては、エンドポイントリファレンス を参照してください。- 可視性の回答
- センチメントの回答
日付範囲内のすべての可視性の回答を取得します。ユースケース: Raw の回答データを使用して、カスタムダッシュボードを構築し、専門的な分析を行います。
POST /v1/prompts/answers HTTP/1.1
Content-Type: application/json
X-API-Key: your_api_key

{
  "category_id": "your_category_id",
  "start_date": "2026-01-01",
  "end_date": "2026-01-07",
  "filters": [
    {
      "field": "prompt_type",
      "operator": "is",
      "value": "visibility"
    }
  ]
}
{
  "info": {},  // removed for brevity
  "data": [
    {
      "created_at": "2026-01-01T08:15:00Z",
      "prompt": "What are the best project management tools?",
      "mentions": ["Company A", "Company B", "Company C"],
      "prompt_type": "open-ended",
      "response": "There are several leading project management tools available today. Company A offers comprehensive project tracking with built-in collaboration features...",
      "citations": ["https://www.example.com/reviews", "https://www.example.com/best-tools"],
      "themes": ["feature comparison", "pricing"],
      "topic": "Project Management",
      "region": "North America",
      "model": "ChatGPT",
      "model_id": "3f8a1b2c-1234-5678-abcd-ef0123456789",
      "asset": "Company A"
    },
    ...
  ]
}
特定のアセットで絞り込んだセンチメントのプロンプト回答を取得します。ユースケース: 特定のブランドについて、モデルやリージョンをまたいで Raw のセンチメント回答を分析します。
POST /v1/prompts/answers HTTP/1.1
Content-Type: application/json
X-API-Key: your_api_key

{
  "category_id": "your_category_id",
  "start_date": "2026-01-01",
  "end_date": "2026-01-07",
  "filters": [
    {
      "field": "prompt_type",
      "operator": "is",
      "value": "sentiment"
    },
    {
      "field": "asset_name",
      "operator": "is",
      "value": "your_company_name"
    }
  ]
}
{
  "info": {},  // removed for brevity
  "data": [
    {
      "created_at": "2026-01-02T11:30:00Z",
      "prompt": "What do users think about Company A's analytics features?",
      "mentions": ["Company A"],
      "prompt_type": "brand-direct",
      "response": "Users generally have positive feedback about Company A's analytics capabilities. The platform is praised for its comprehensive dashboard and intuitive reporting features...",
      "citations": ["https://www.example.com/review/company-a"],
      "themes": ["analytics quality", "ease of use"],
      "topic": "Product Feedback",
      "region": "Europe",
      "model": "Perplexity",
      "model_id": "c4d5e6f7-3456-7890-cdef-012345678901",
      "asset": "Company A"
    },
    ...
  ]
}