This article describes the redesigned Answer Engine Insights. To switch to the original design, go to Answer Engine Insights settings > Use legacy UI.
Filters
Filters are available throughout Answer Engine Insights. They allow you to adjust the analytical time frame, narrow the data view, and save views you return to often. Filters appear as dropdowns beneath the top navigation bar.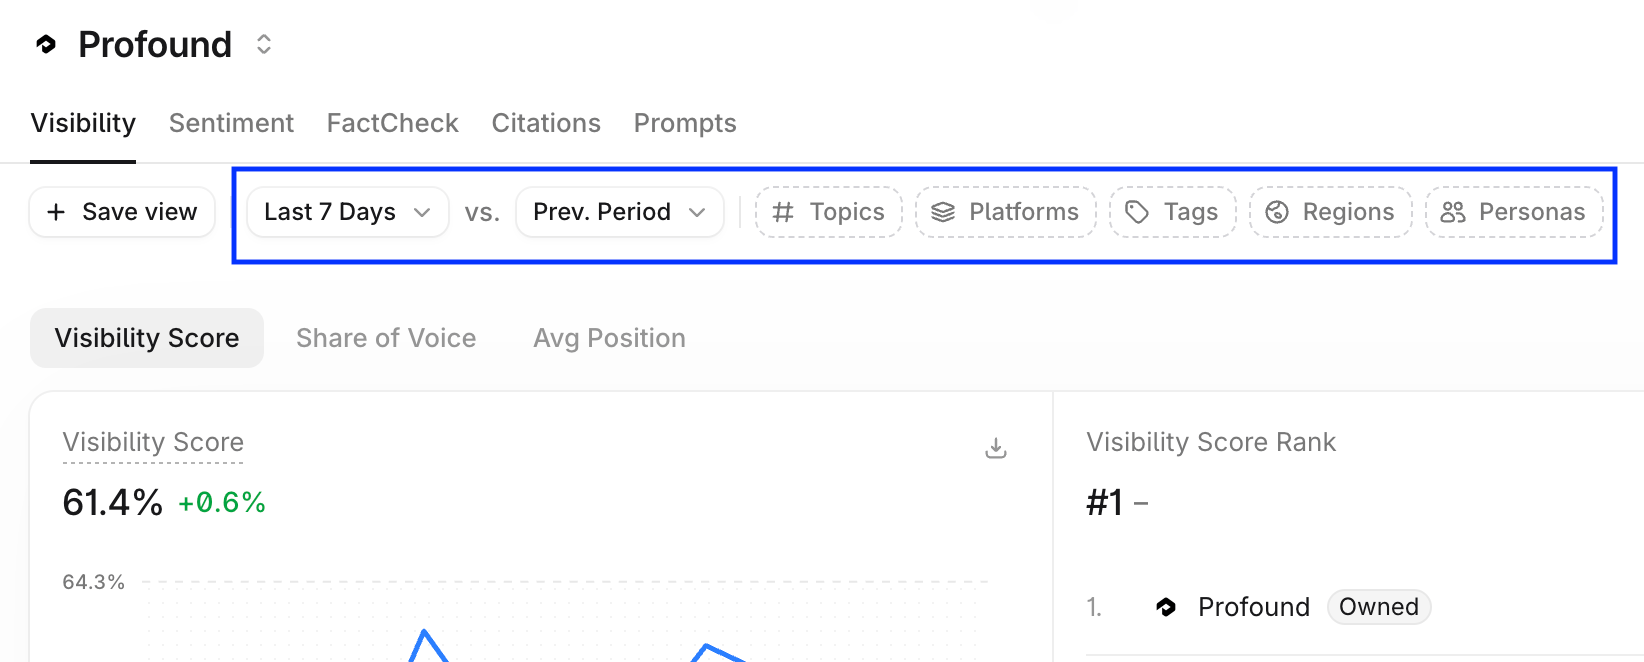
Date range and comparison period
Use the date range filter to select the time window of the answer engine response collection. Choose a preset window (such as Last 7 Days) or define a custom range using the calendar selector. After you select a time frame, only answer engine responses generated during that period appear in the charts. Charts show change by comparing the selected time frame to a comparison period. Open the Prev. Period dropdown to choose how the comparison period is calculated:- Prev. Period: the window immediately before the selected date range, of the same length.
- Prev. Period Last Month: the same window one month earlier.
- Custom range: any date range you define.
Attribute filters
Attribute filters narrow the data shown on every chart in the current tab. To apply one, open the dropdown for the attribute (Topics, Platforms, Tags, Regions, Competitors, or Languages) and select the values to include. If your configuration uses Personas, a Personas filter is also available. Use the Competitors filter on the Visibility tab to choose which of the brands you track appear in its charts and rank lists. The Citations tab adds two filters of its own: Prompt Type and Citation Categories. Select + to add more filters to the bar.Save view
Select Save view to store the current combination of date range, comparison period, and filters. Saved views let you return to a specific analysis without rebuilding it each time.Export
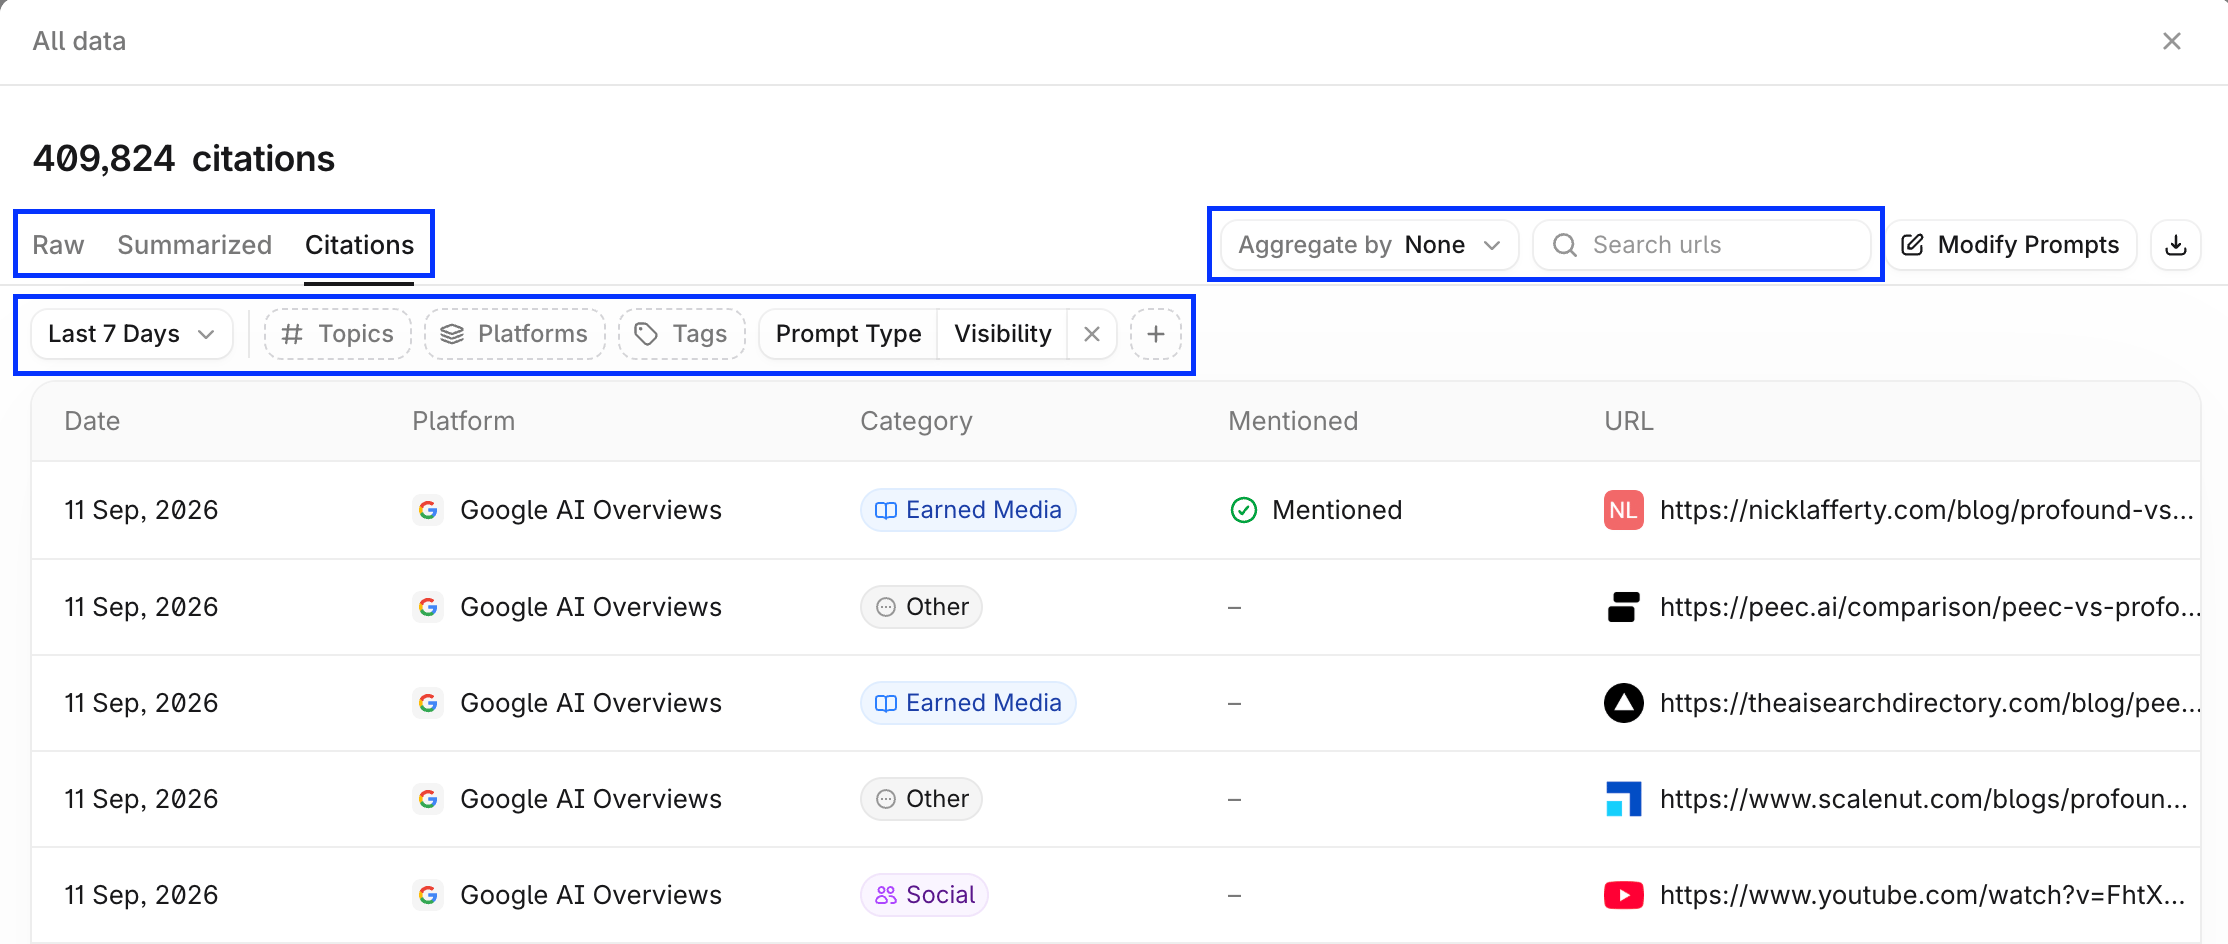
Select Export in the top right of the tab to download the underlying data for the current filters. The Visibility, Sentiment, FactCheck, and Prompts tabs export answers. The Citations tab exports citations.Settings
Select the gear icon in the top right to open Answer Engine Insights settings. See the Answer Engine Insights settings for details.The Compare dropdown
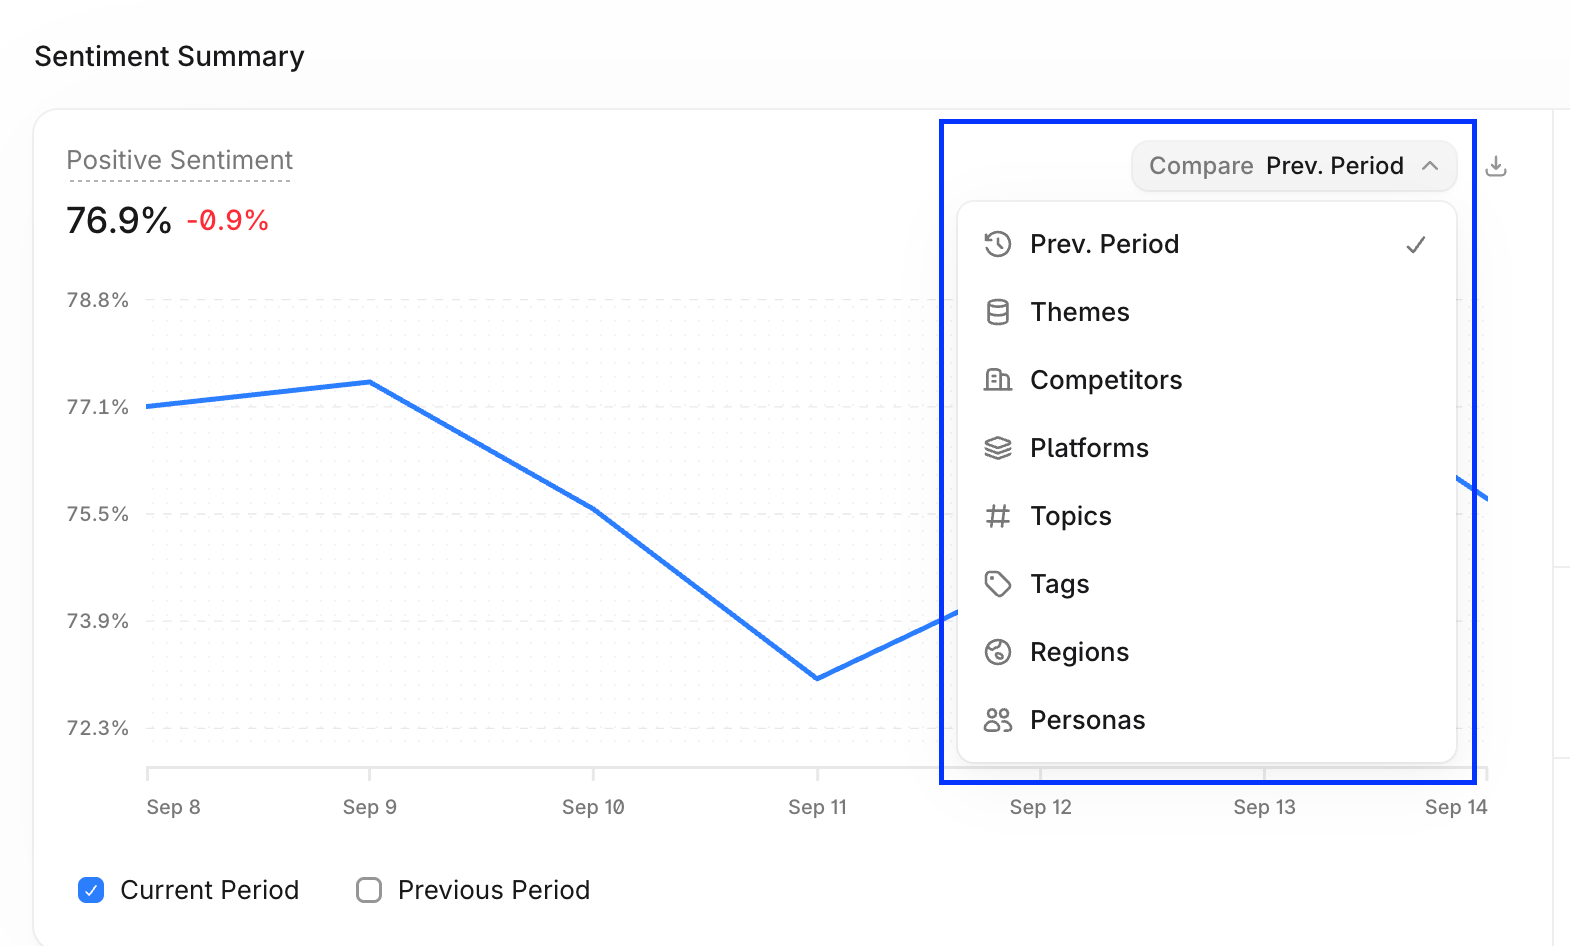
Most charts in Answer Engine Insights include a Compare dropdown in their top right corner.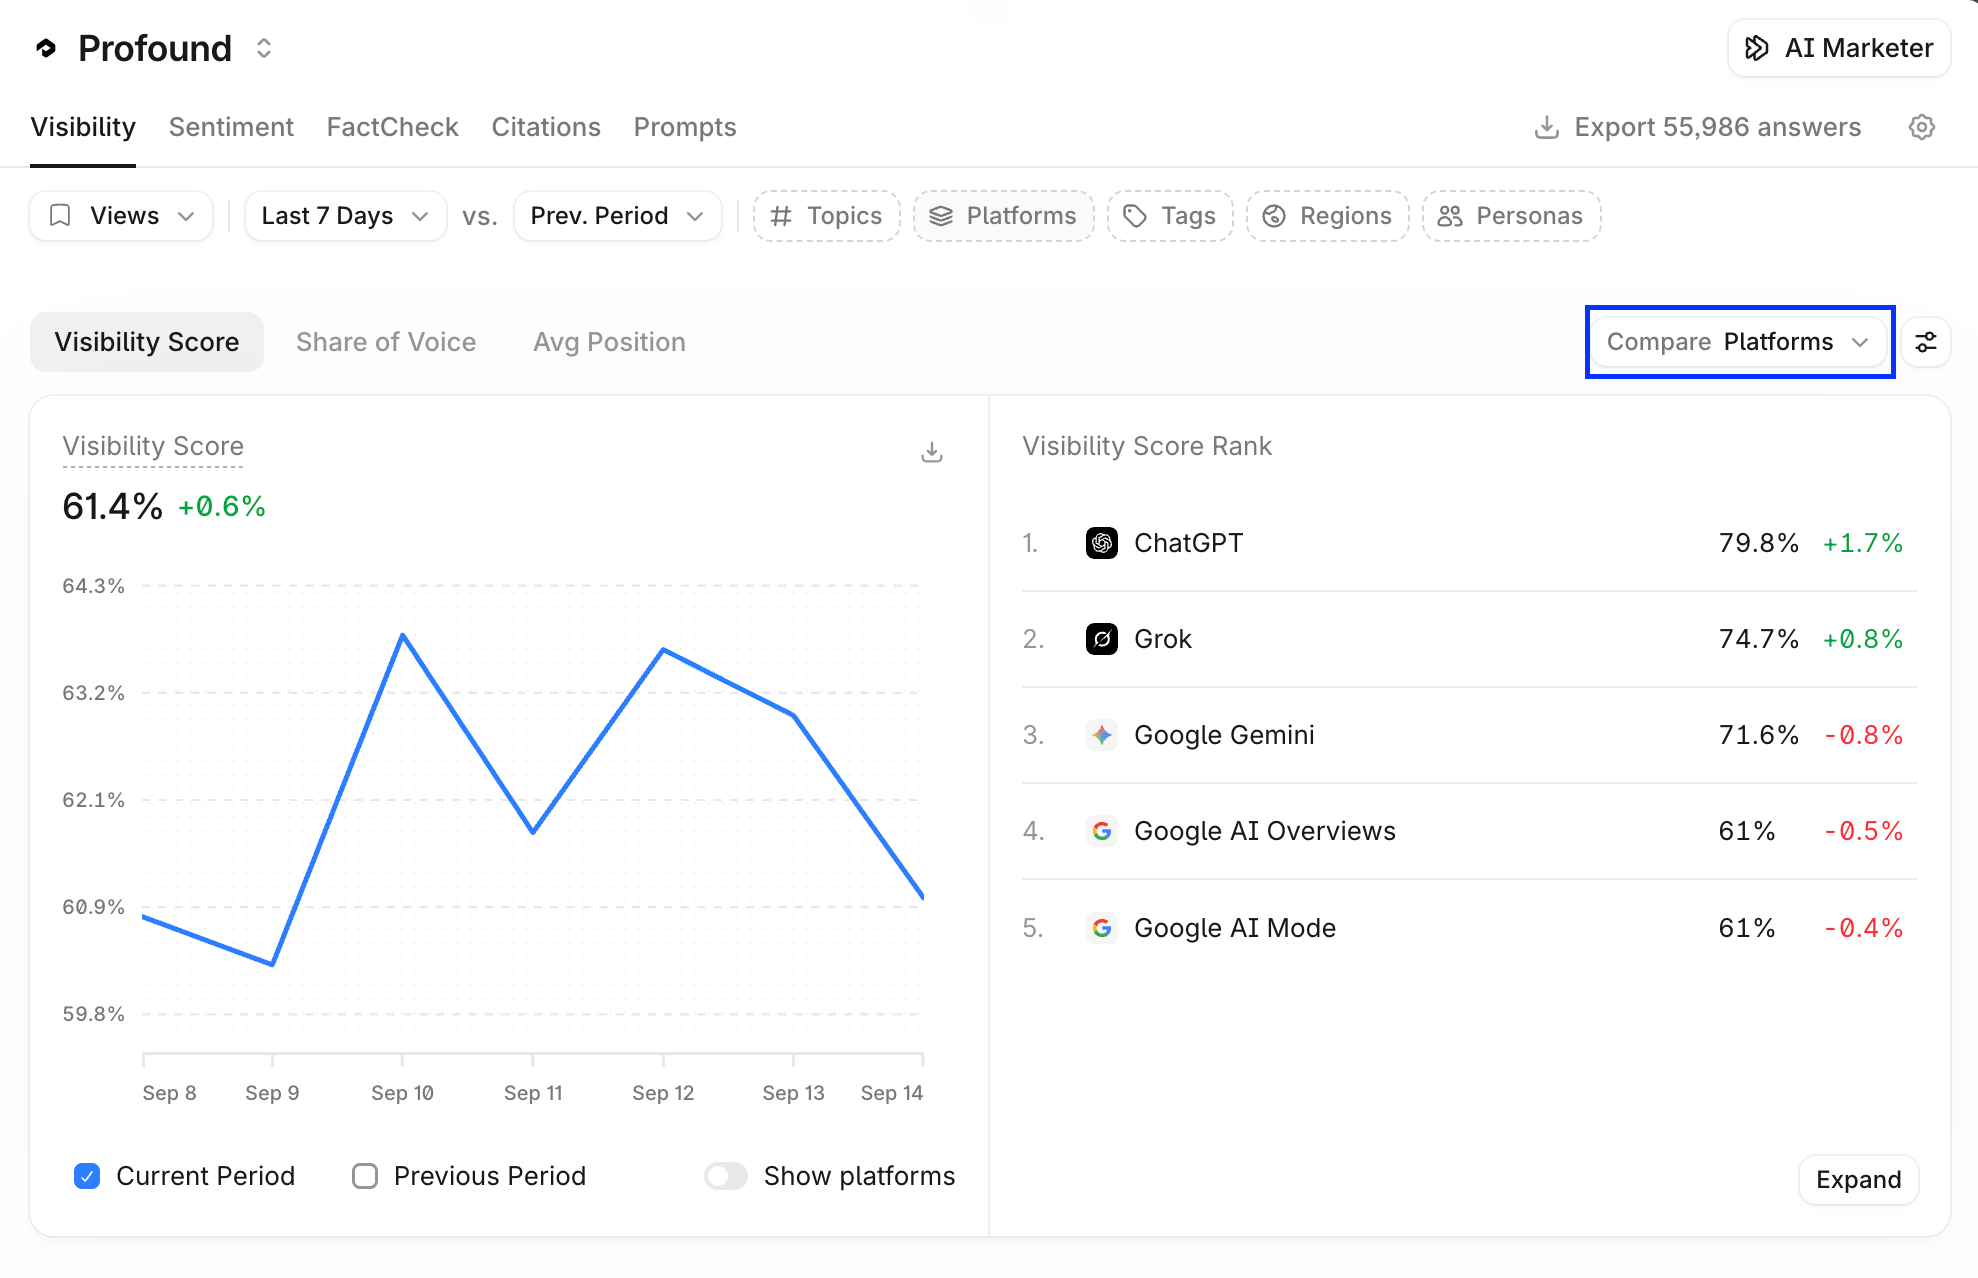
- Competitors: your brand and the brands you track, one line or row per brand. This is the default for the main Visibility chart.
- Platforms: one line or row per answer engine, such as ChatGPT, Perplexity, or Google AI Overviews.
- Topics: one line or row per topic.
- Tags: one line or row per prompt tag.
- Regions: one line or row per region you track.
- Personas: one line or row per Persona, if your configuration uses Personas.
Visibility
The Visibility tab breaks down your brand’s presence in answer engine responses.Visibility Score, Share of Voice, and Average Position
The top chart has three sub-tabs that switch the metric: Visibility Score, Share of Voice, and Avg Position.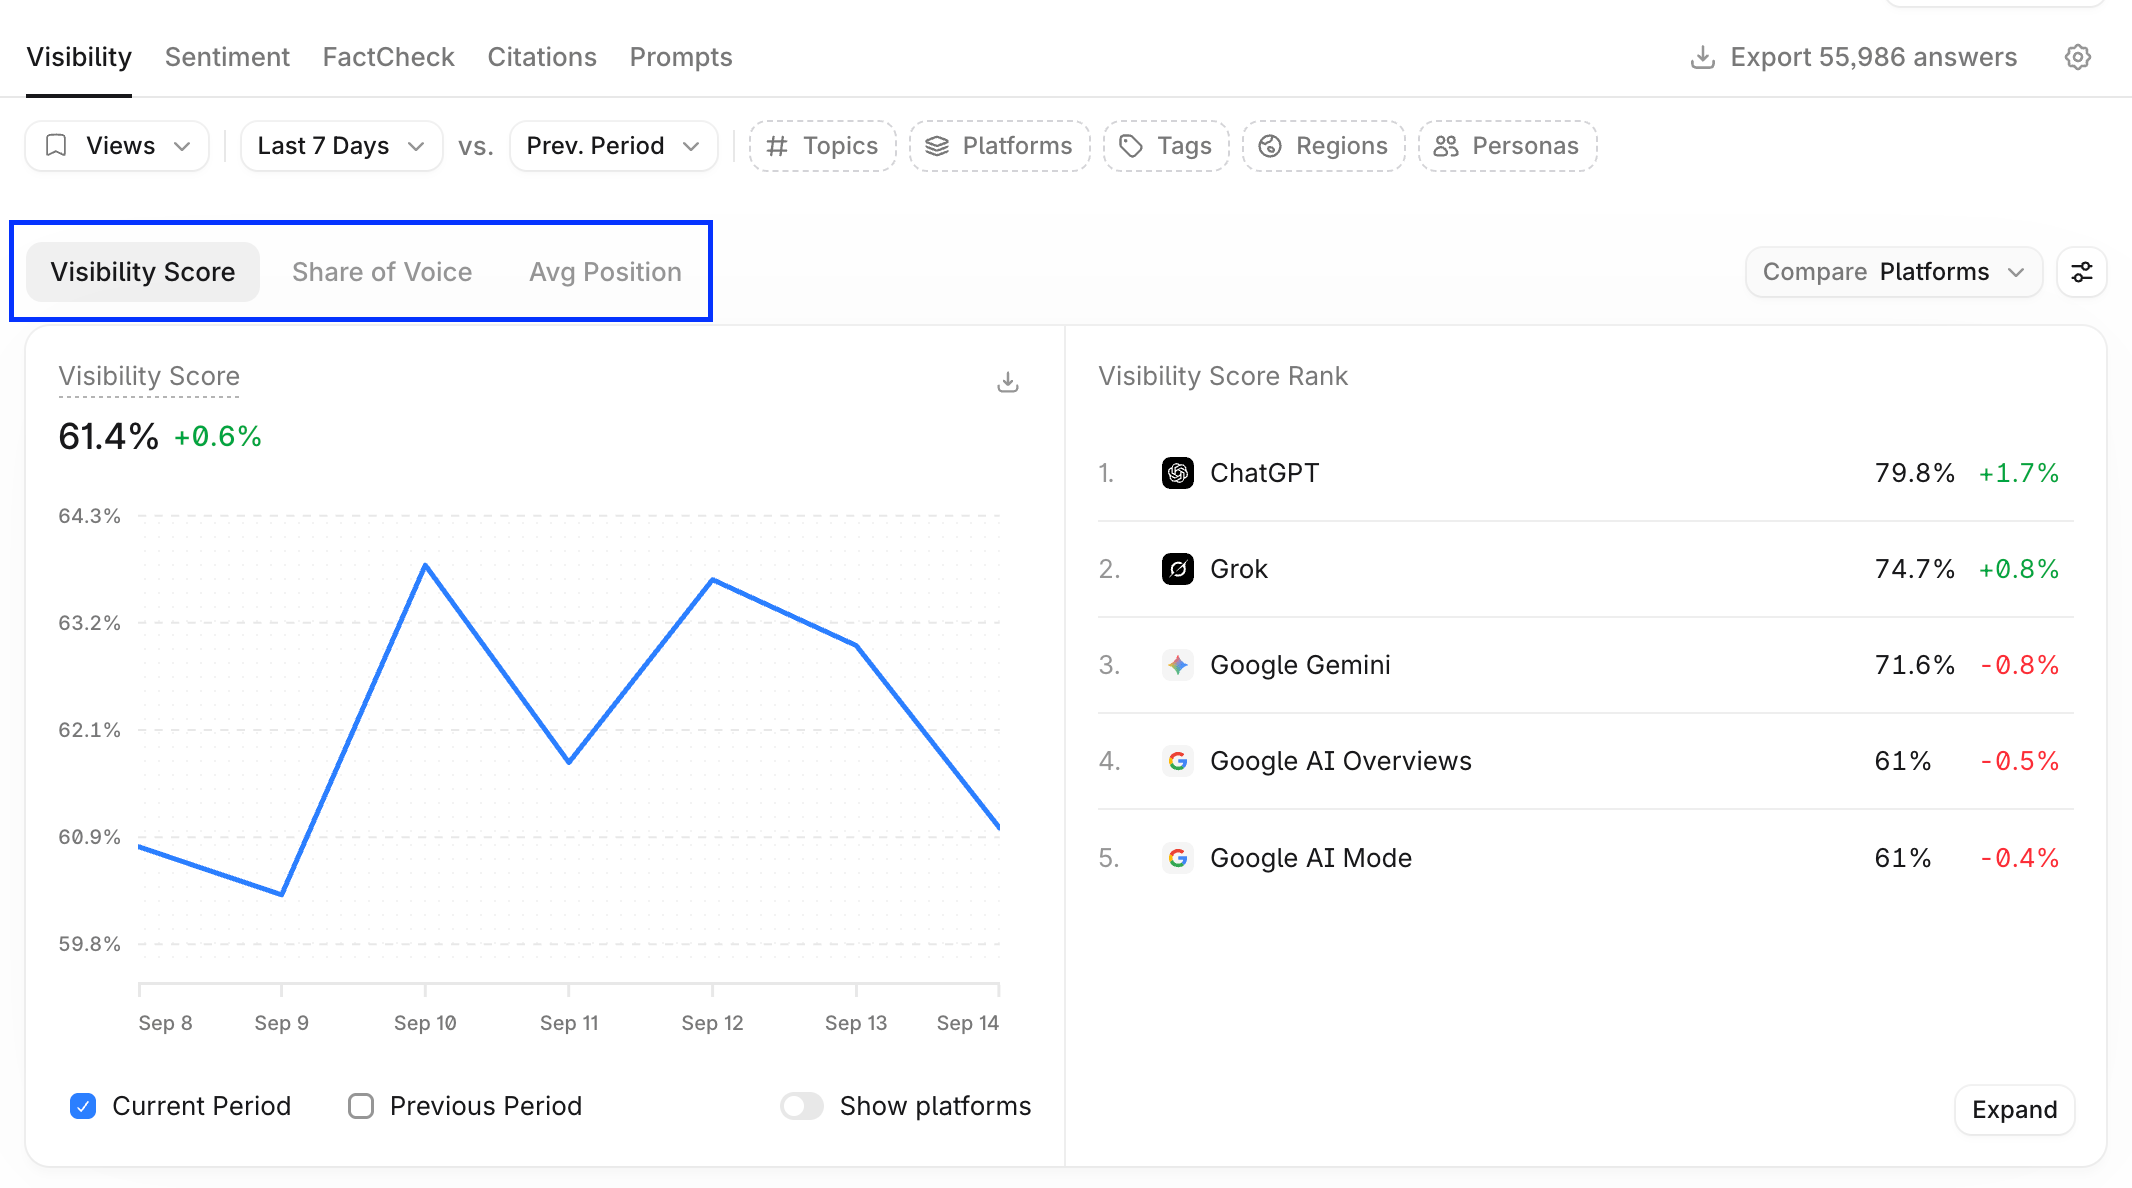
- The line chart shows the metric over the selected date range. Select Current Period or Previous Period at the bottom of the chart to show or hide either line, and toggle the Show … option to overlay the brands you track.
- The rank list shows your brand’s rank by the selected metric relative to competitors, with the change versus the comparison period. Select Expand to see the full list. When the chart compares topics or tags, select a row to open that topic or tag’s subpage.
Visibility Trends
Visibility Trends shows the largest movements in Visibility Score during the selected period, split into Biggest Spikes and Biggest Drops. Each item shows a sparkline, the current score, and the change versus the comparison period.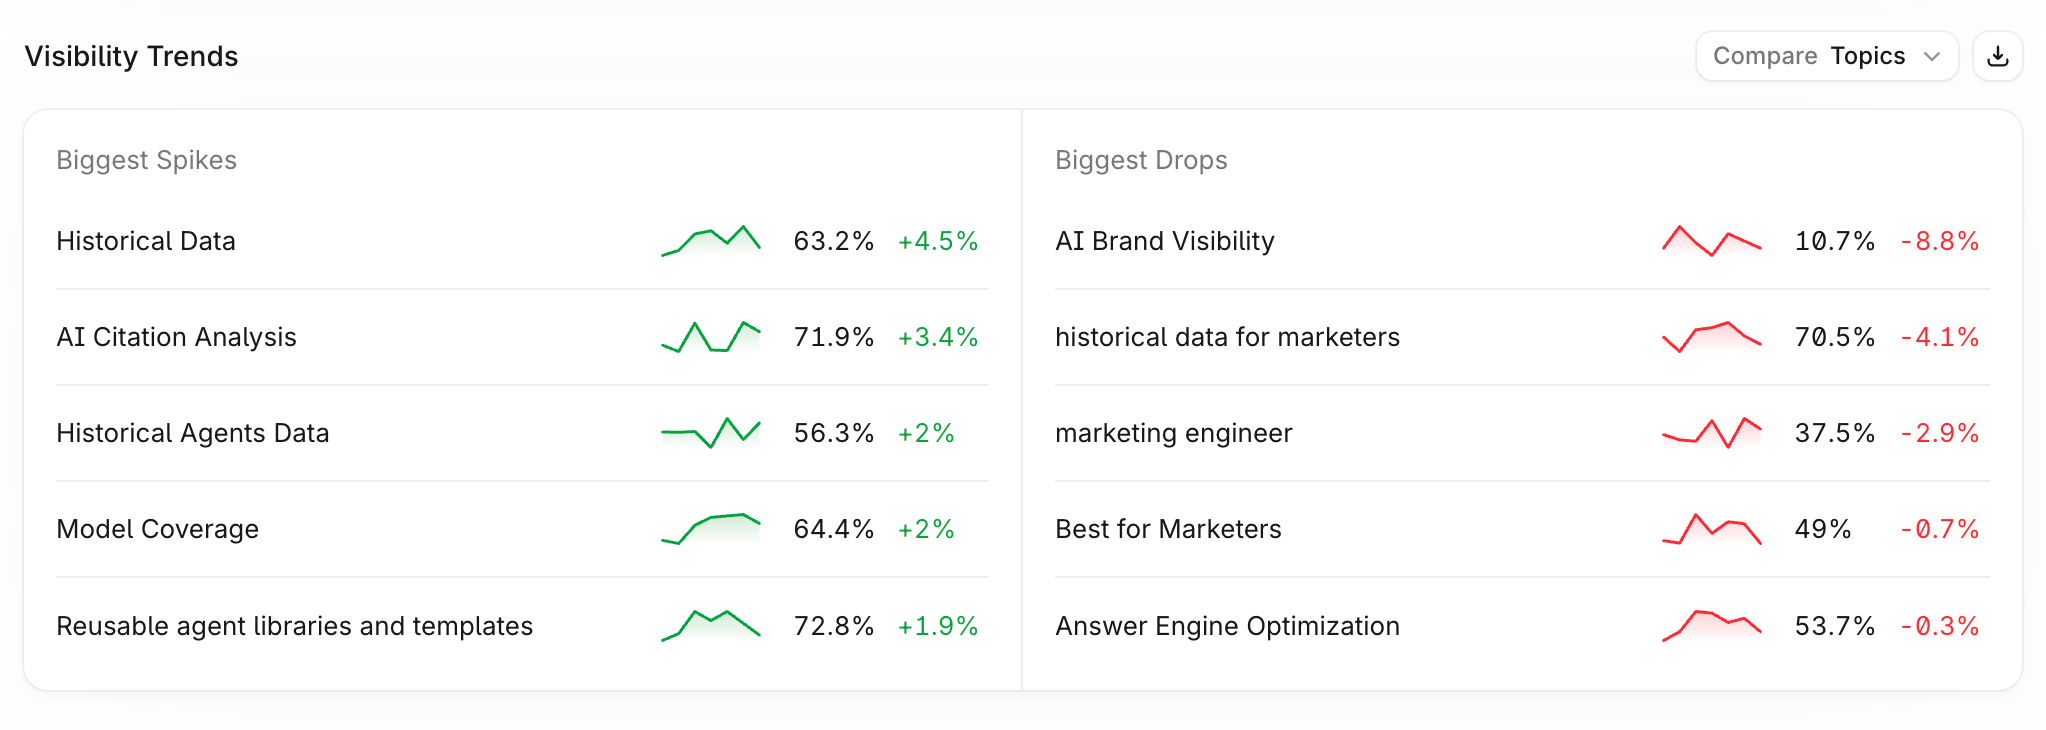
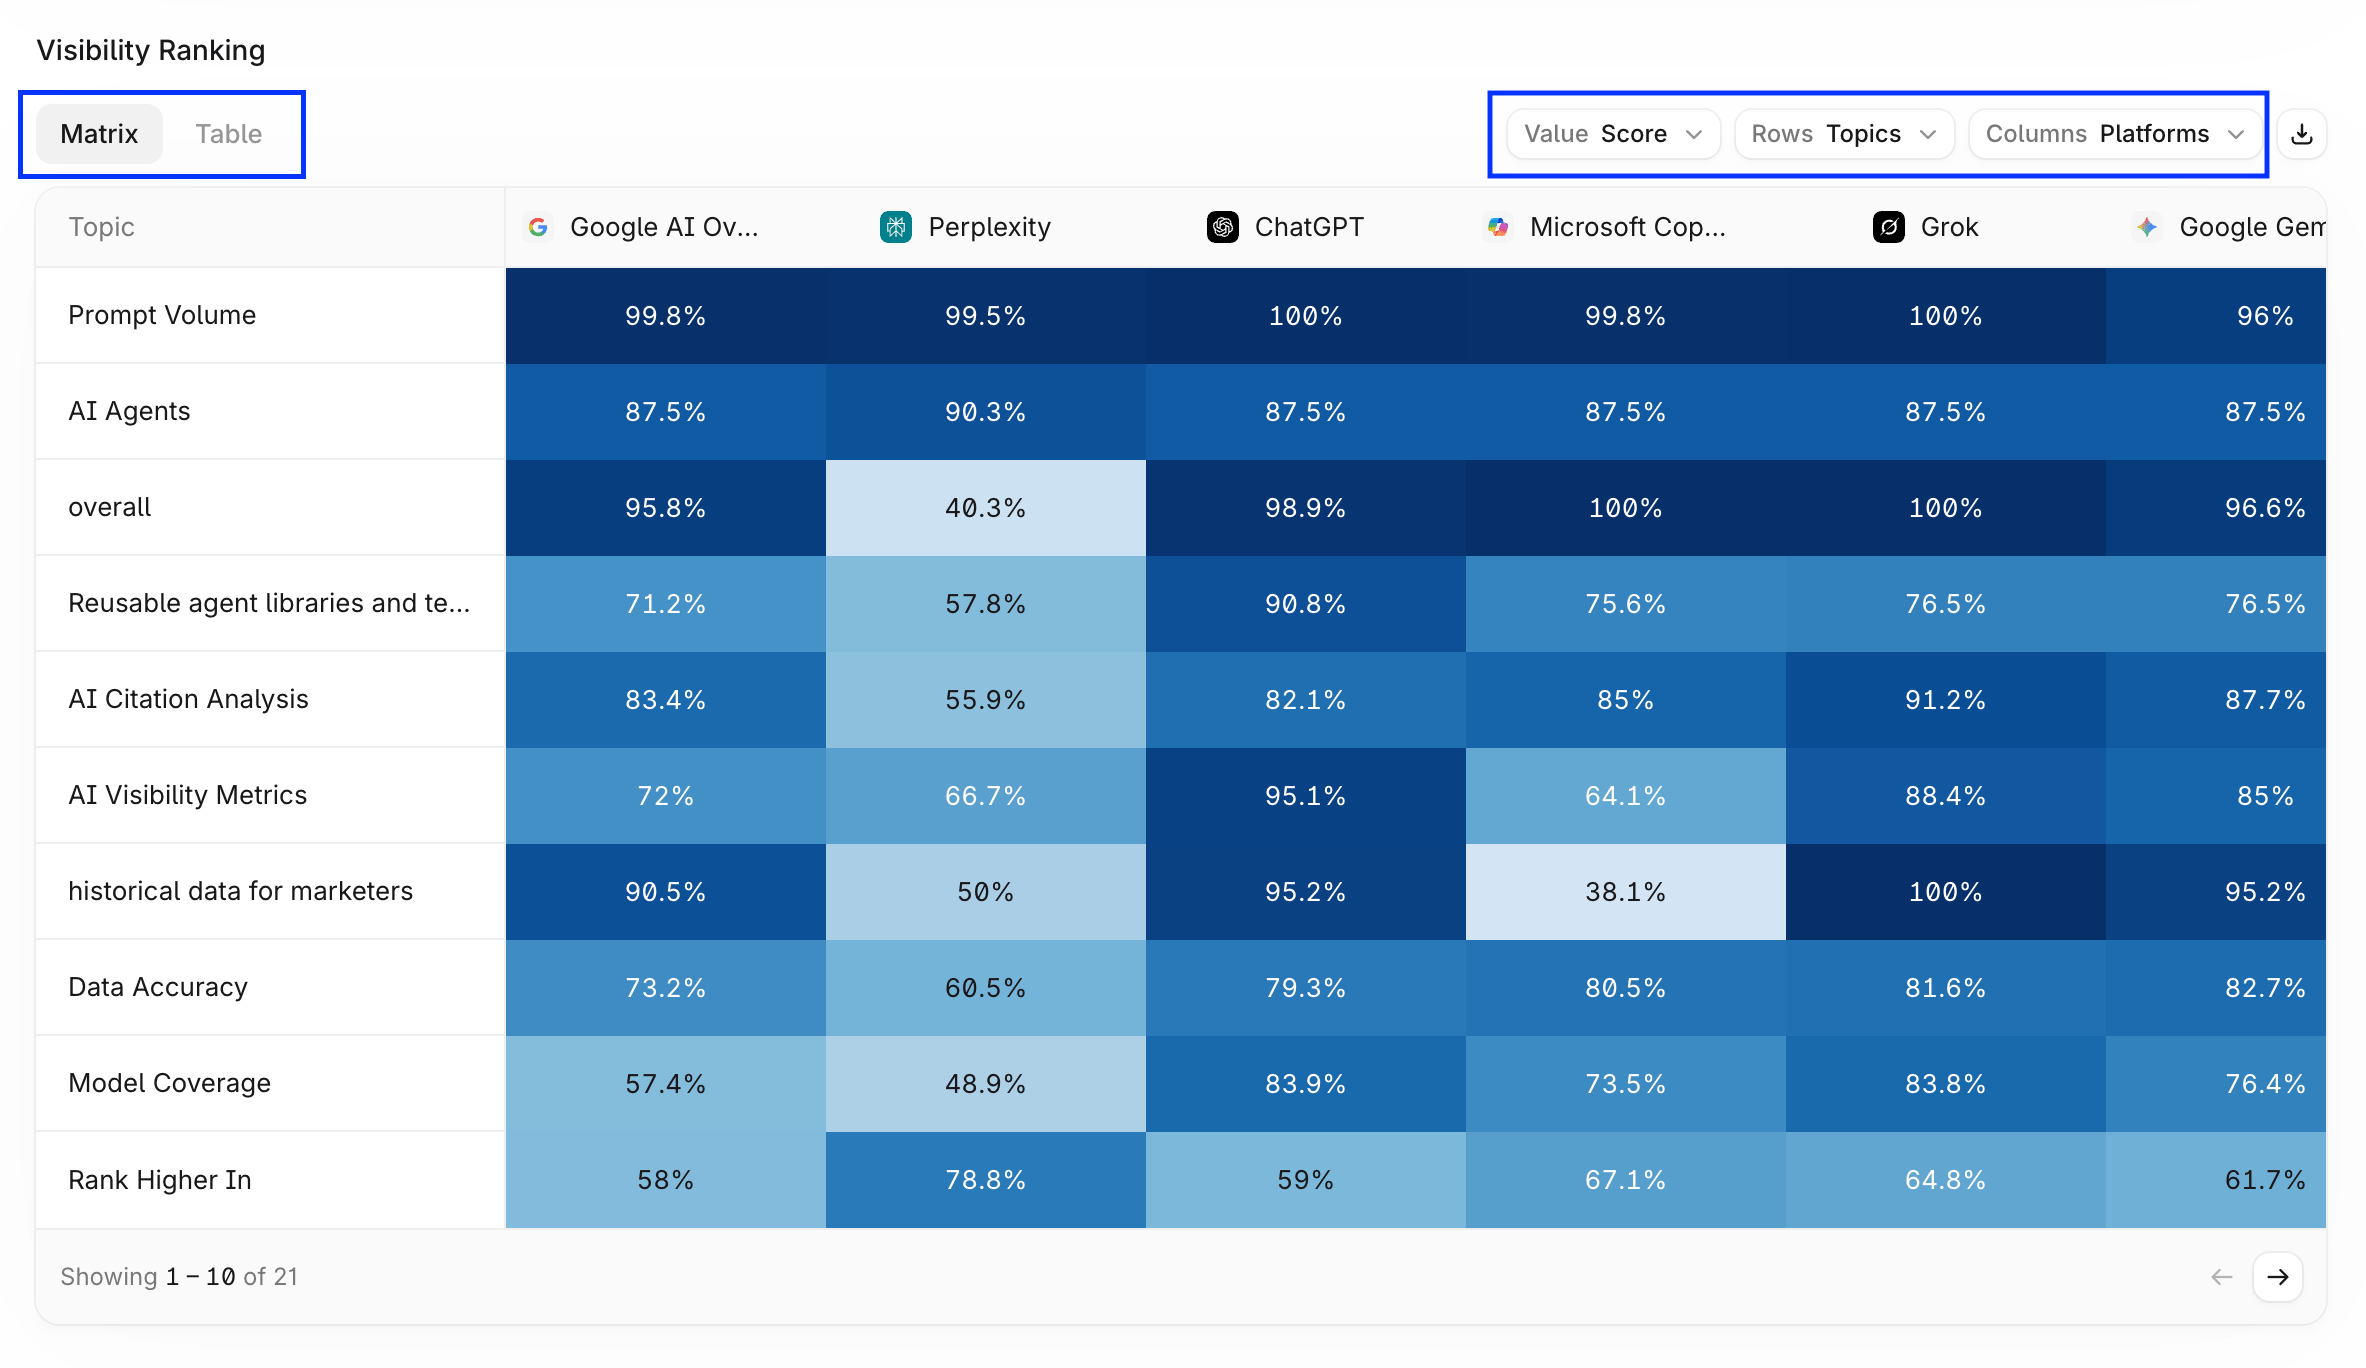
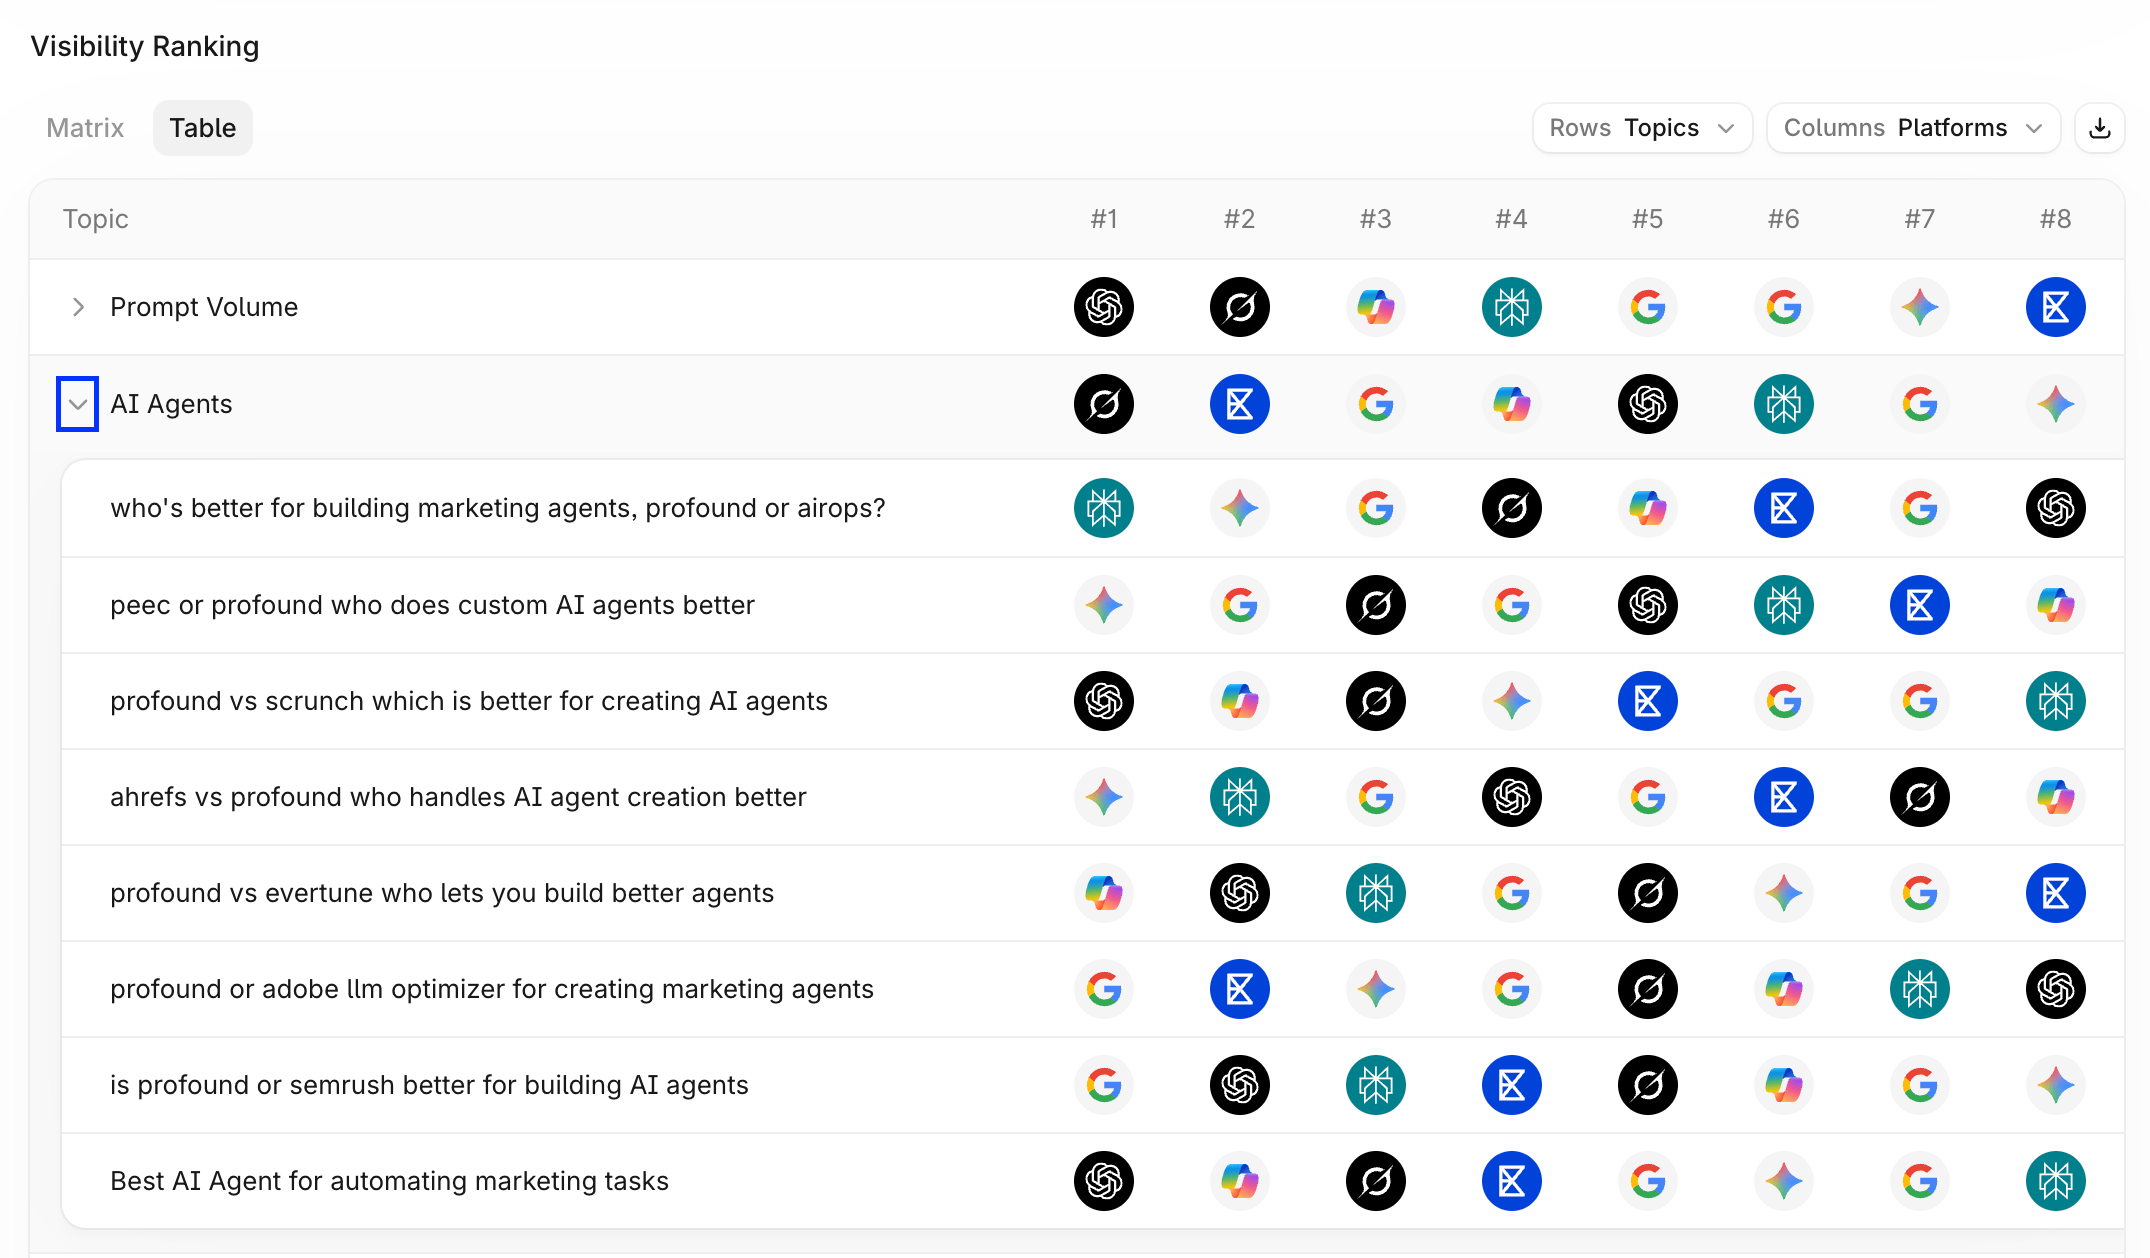
Visibility Ranking
Visibility Ranking is a customizable heat map that shows how two dimensions intersect, for example how each platform performs in each topic. Configure it with the controls above the table:- Value: show the Visibility Score as a percentage, or show rank instead.
- Rows: the dimension shown as rows, such as topics, tags, regions, or platforms.
- Columns: the dimension shown as columns, such as competitors or platforms.
Topic Prioritization
Topic Prioritization plots each topic by its Visibility Score and Citation Share so you can decide where to focus.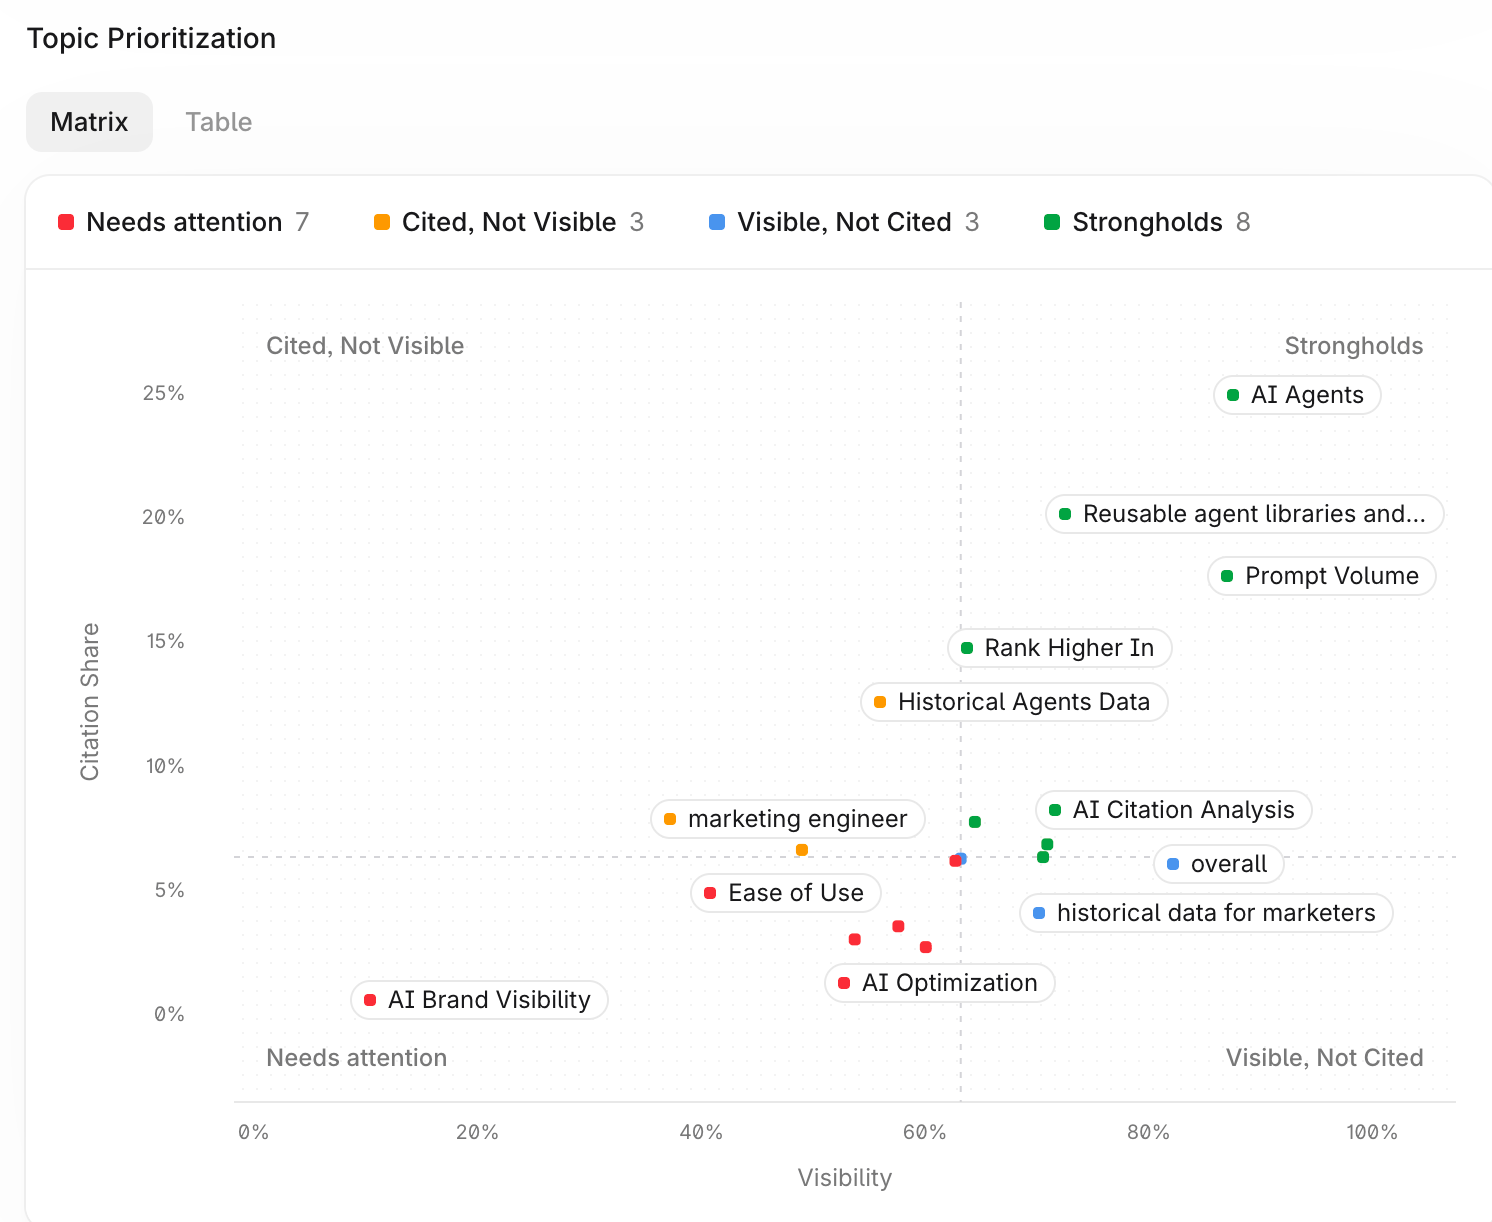
Select Table above the plot to view the same data as a ranked list.
Citations
The Citations tab assesses how often answer engine responses cite your domains, and which other sources they rely on.Citation Share and Citation Coverage
The top chart has two sub-tabs that switch the metric: Citation Share and Citation Coverage.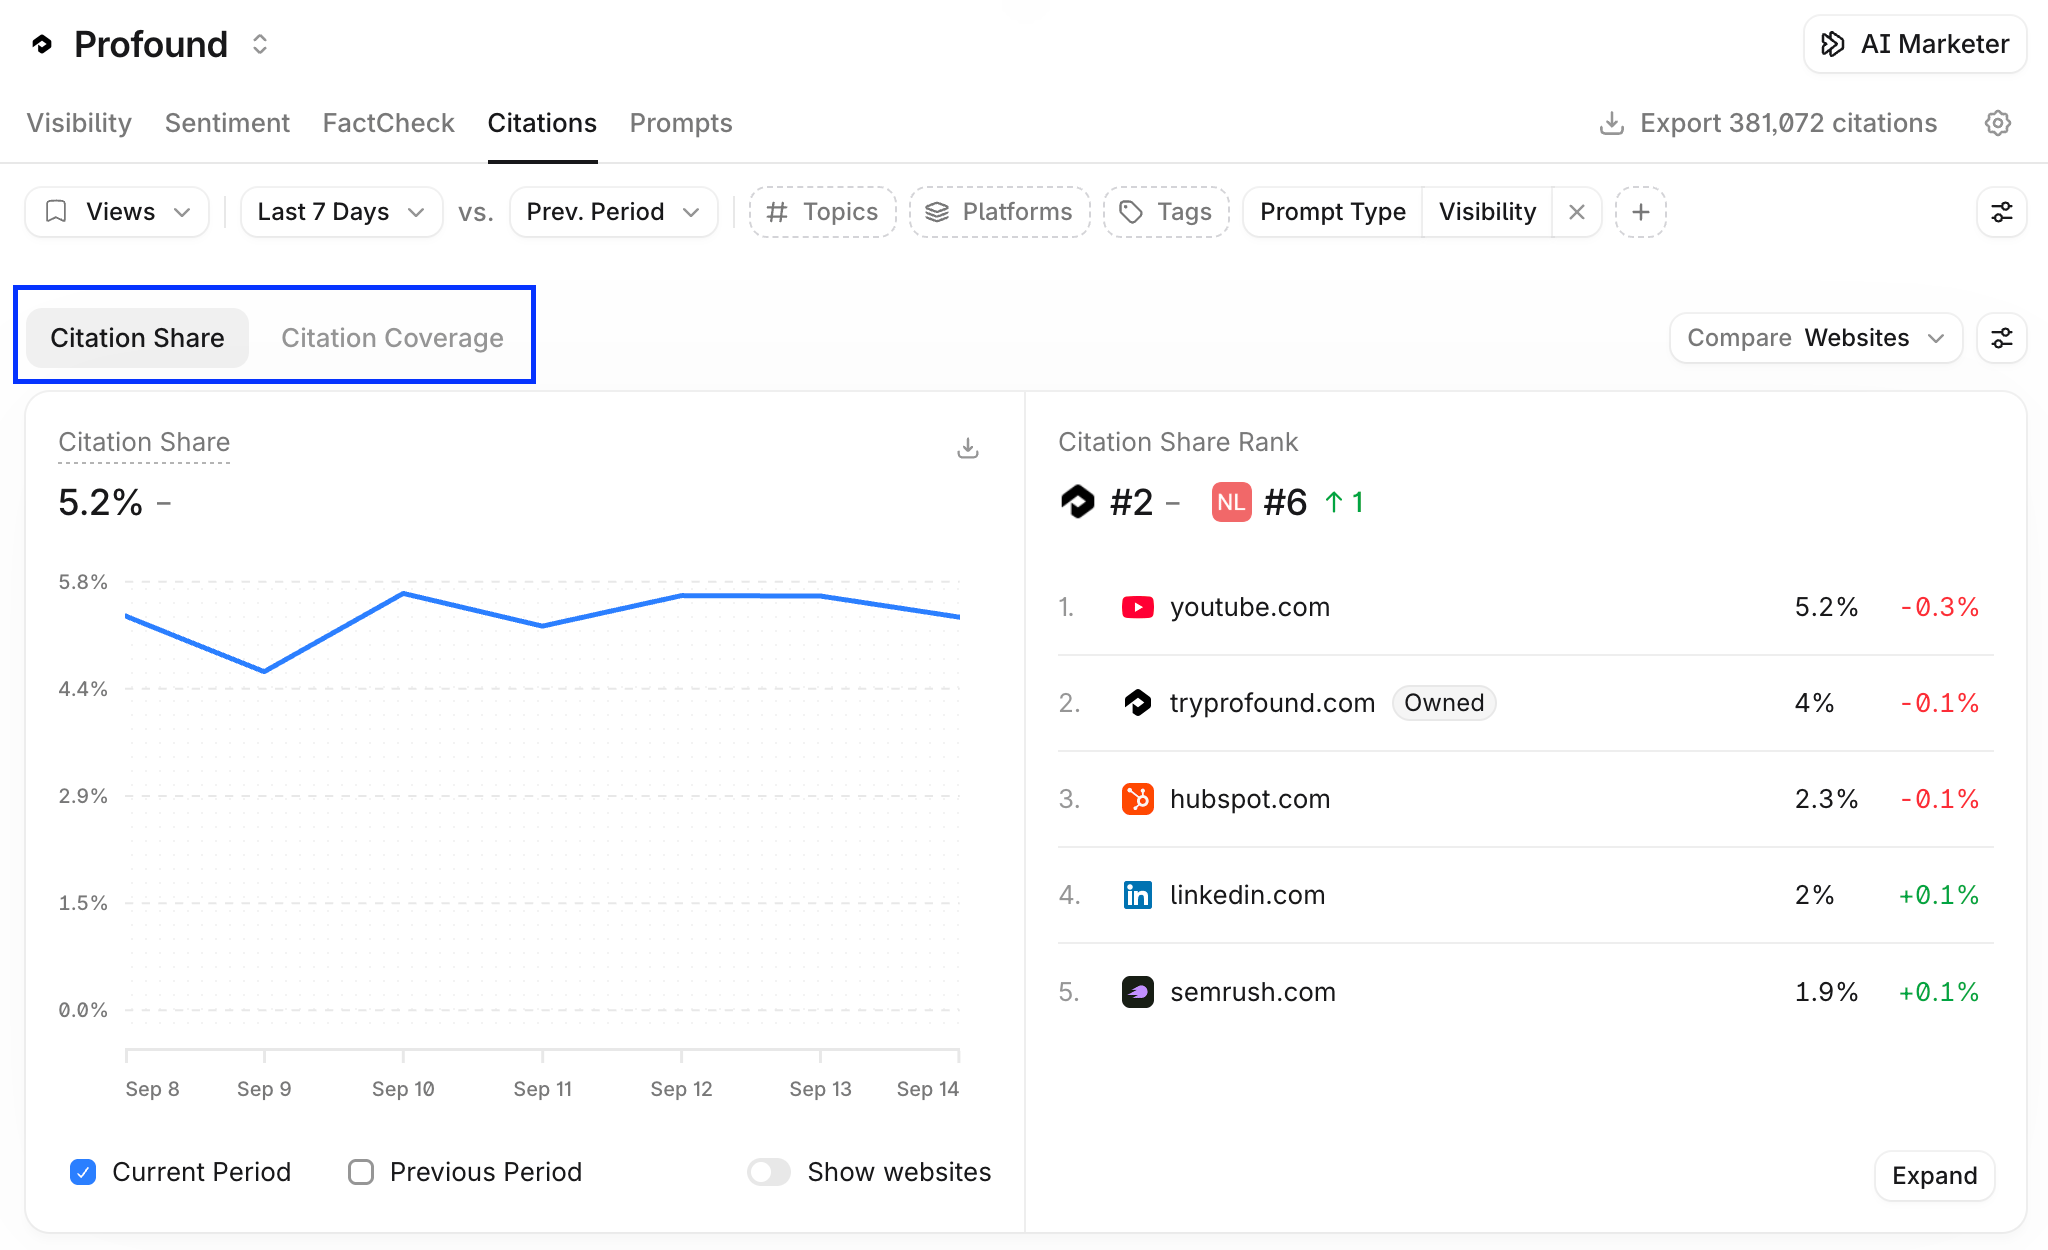
- The line chart shows the metric over the selected date range. Select Current Period or Previous Period at the bottom of the chart to show or hide either line, and toggle the Show … option to overlay other domains.
- The Citation Share Rank list ranks the most cited domains, with your owned domains marked Owned. Select Expand below the table to see the full list.
Citation Categories
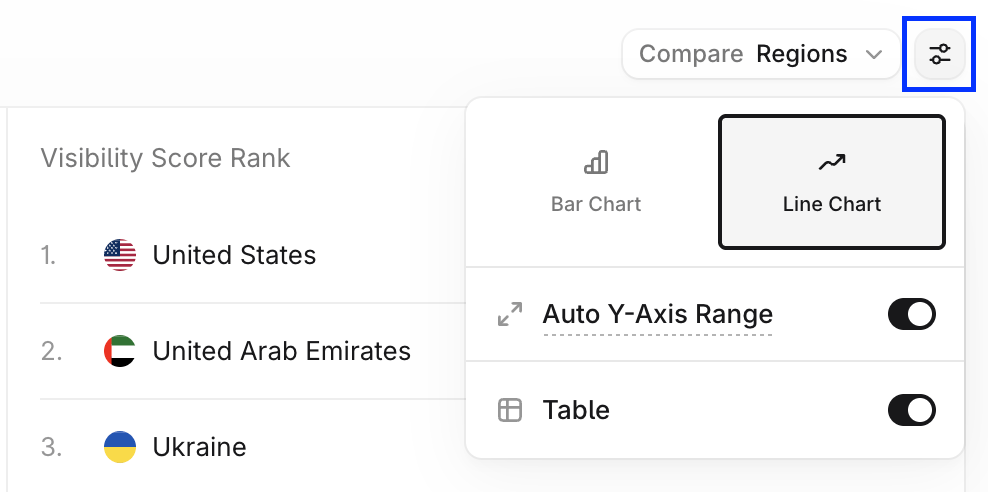
Citation Categories classify the sources AI platforms cite, helping you understand where your visibility comes from and identify opportunities. The Citation Share by Category chart shows the share of citations for each category. Use the chart settings on the top right of the chart to switch to a line chart and see how each category trends over time.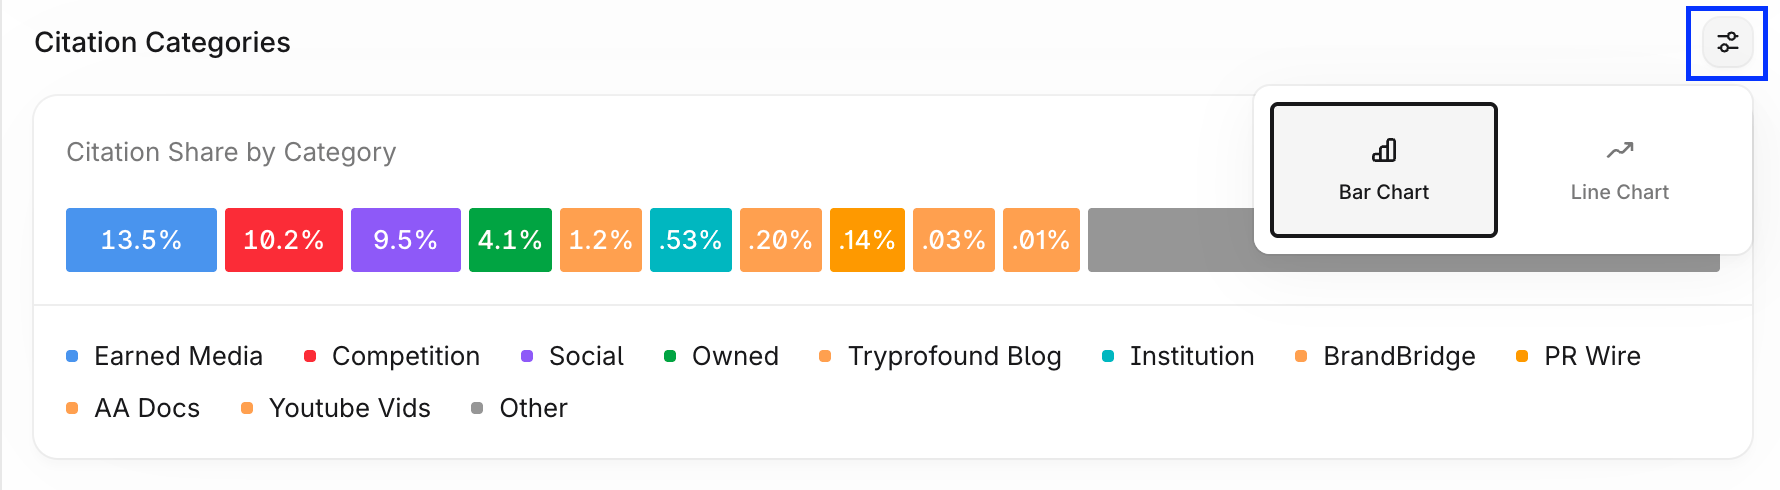
All Citations
All Citations is a ranked table of every cited source in the selected period. Use the search box above the table to find a domain or page, the settings icon to adjust the table, and the download icon to export it.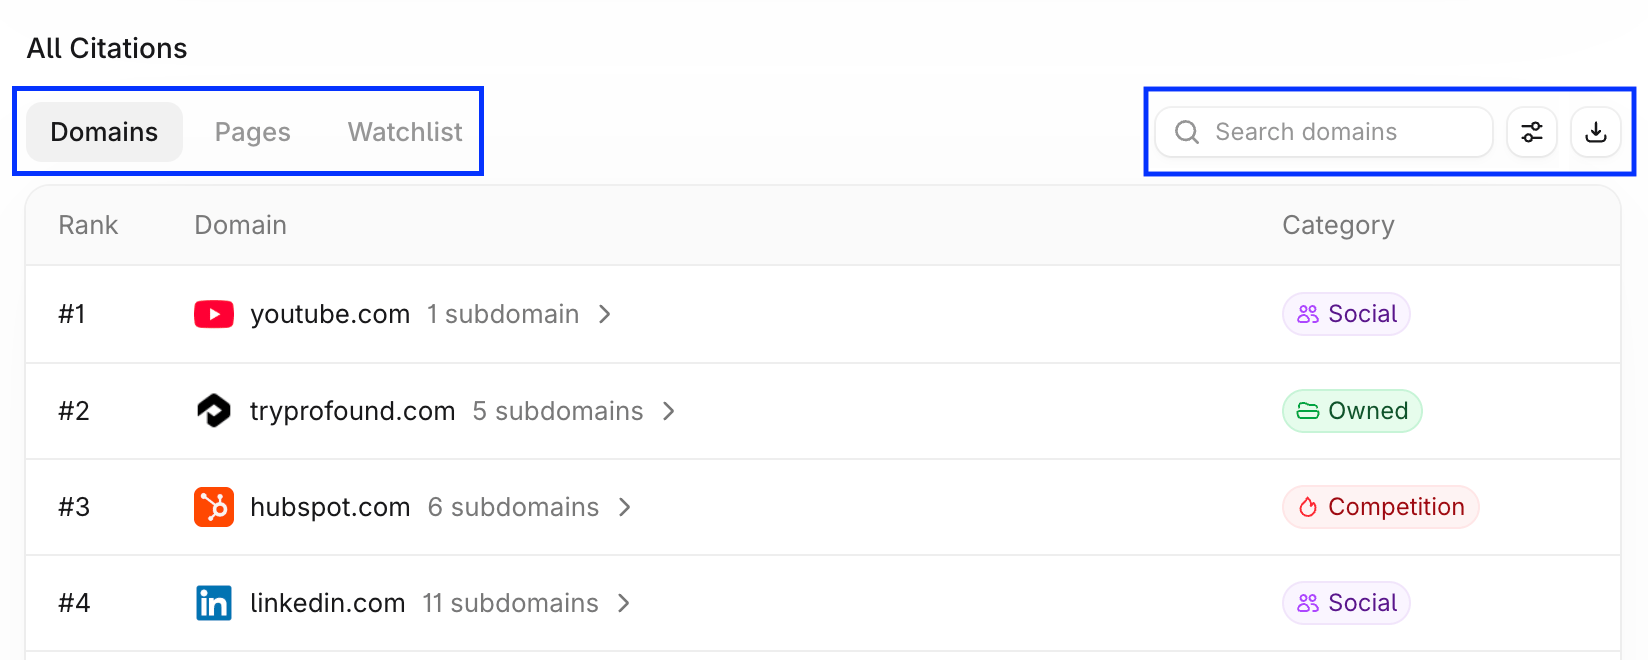
- Domains: the most frequently cited domains. Each row shows the domain, its category, its citation share, and any citation tags. Domains with several cited subdomains show the subdomain count.
- Pages: the most referenced individual URLs. Multiple pages from the same domain can appear in this list.
- Watchlist: specific URLs you choose to track for citation performance. While Pages lists the most cited pages overall, the Watchlist lets you define and monitor a custom set of URLs.
Citation Decay
Citation Decay shows how long sources keep getting cited after they first appear. Switch between Domains and Pages. The summary at the top shows the Average Rise (days from first citation to peak citation count) and Average Half-life (days for citations to fall to half of their peak and stay there) across all sources.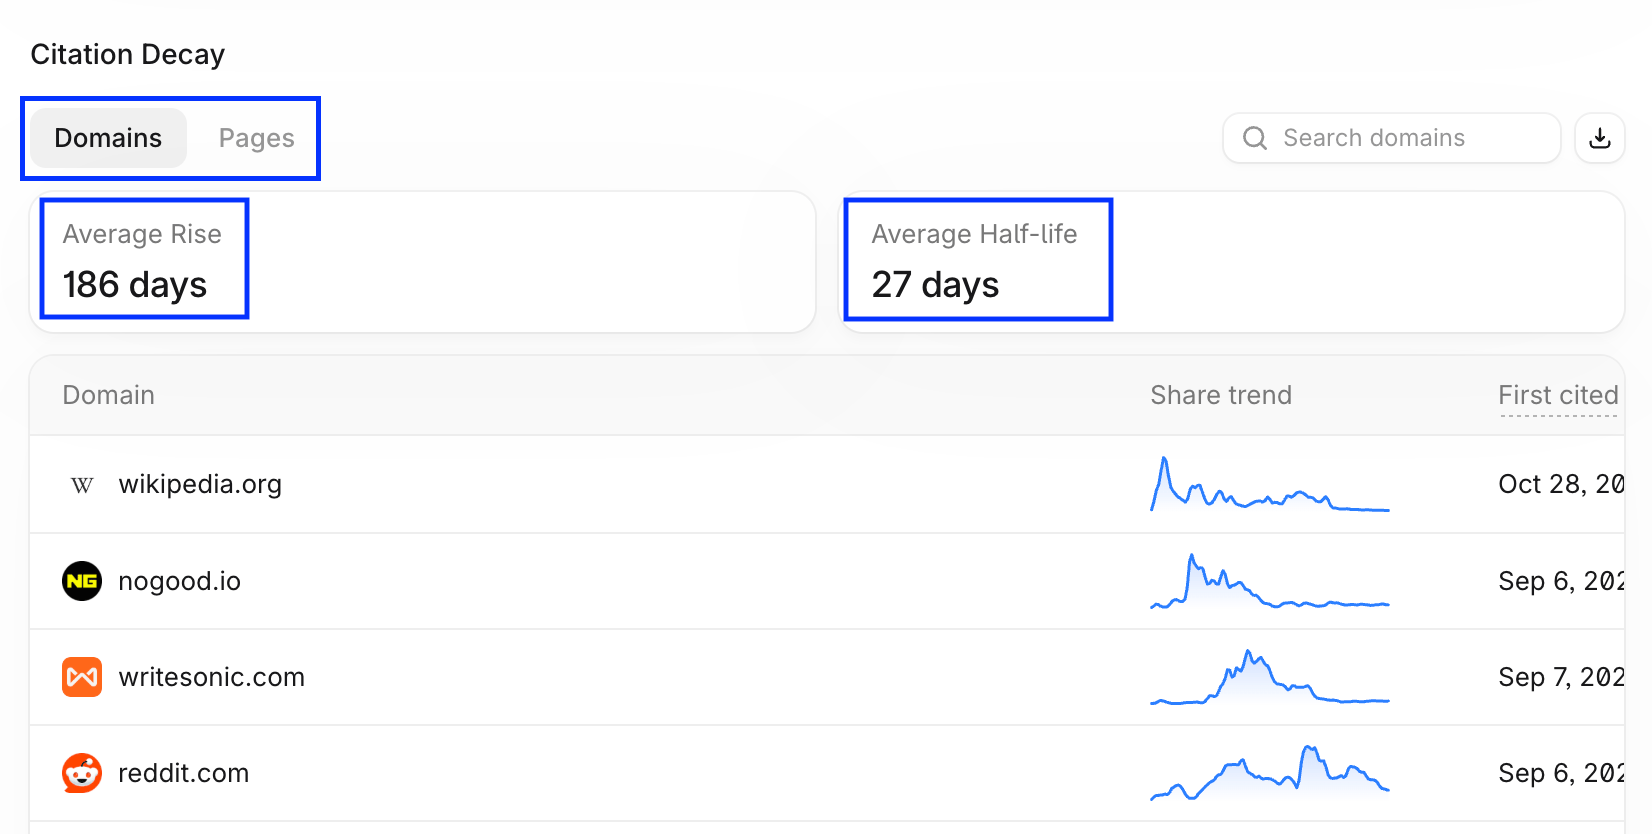
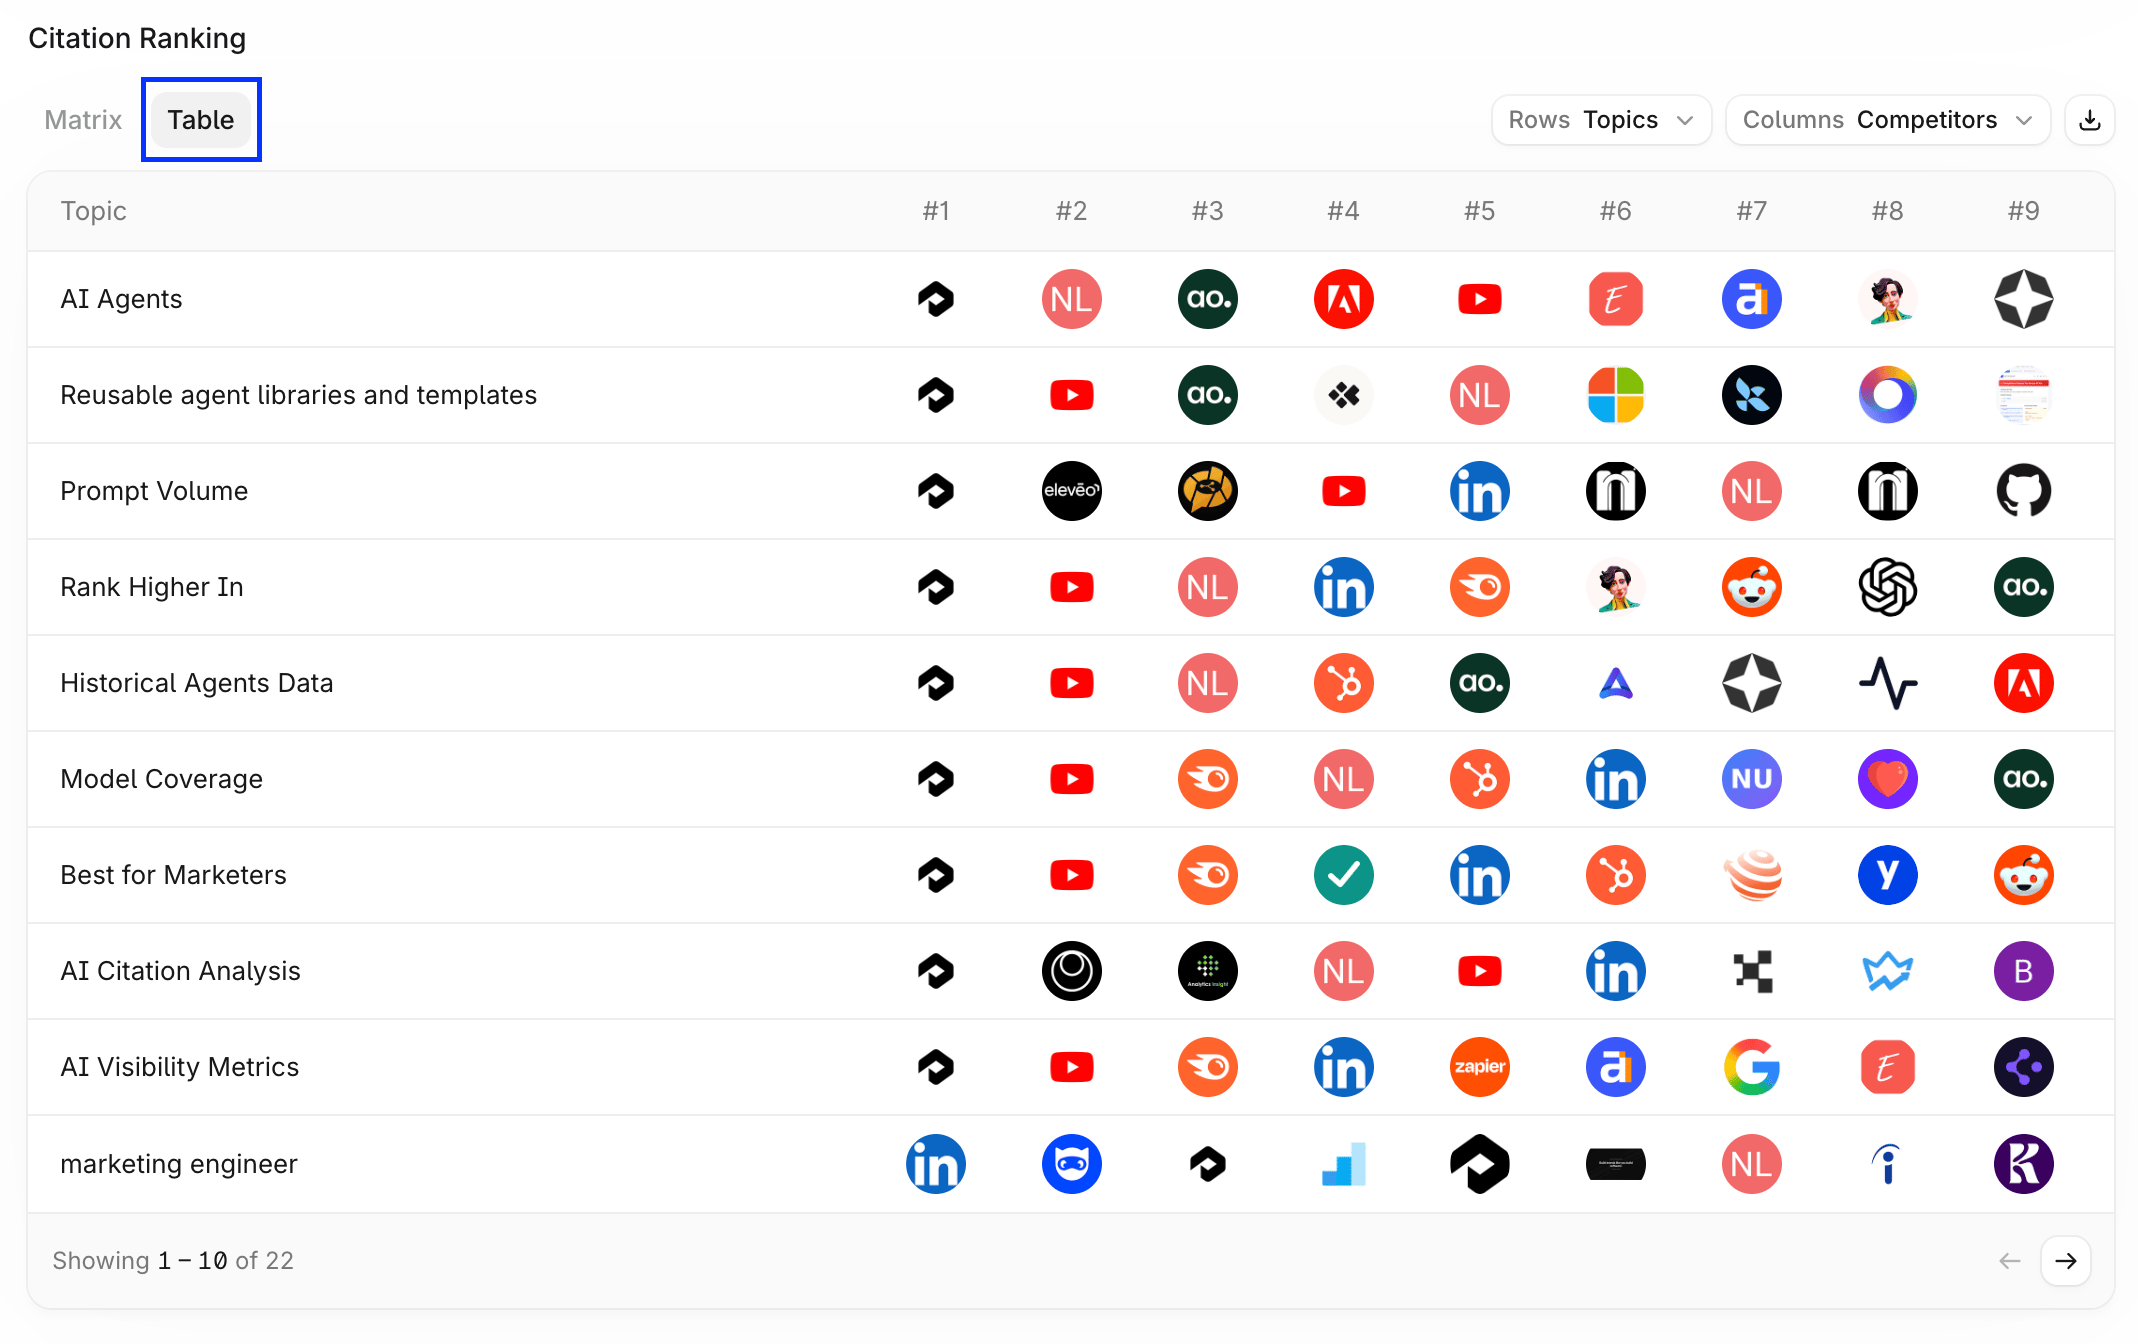
Citation Ranking
Citation Ranking is a customizable heat map of citation share across two dimensions, for example how much each domain is cited within each topic. Configure it with the Value, Rows, and Columns controls, the same way as Visibility Ranking.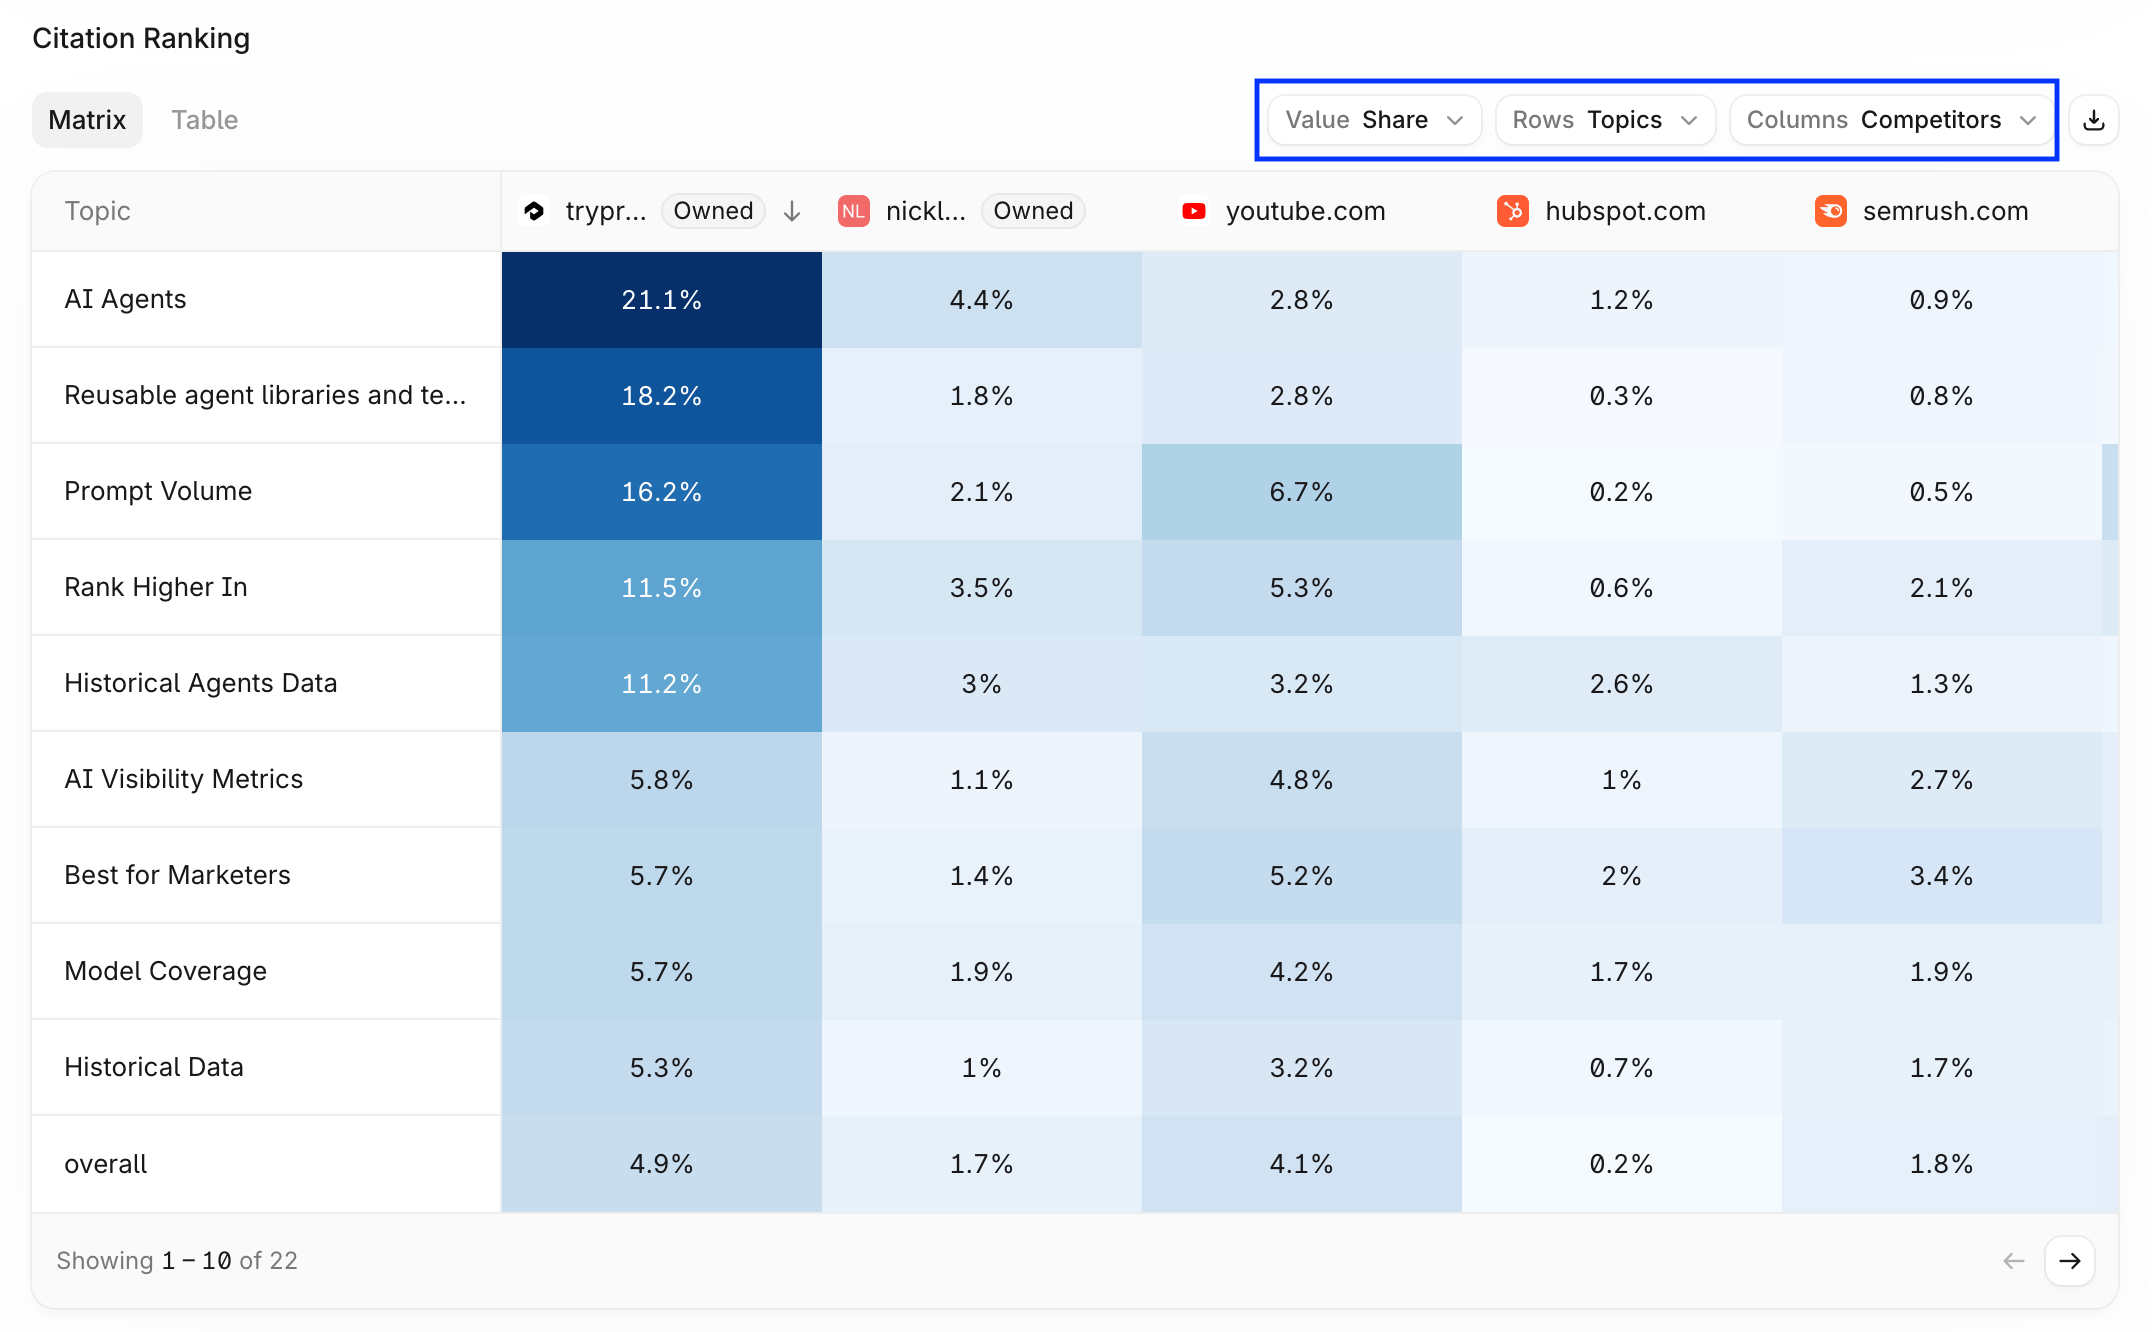
Citation Relationships
The Citation Relationships chart visualizes how citations are connected across answer engines and topics. Select 3D or 2D, then select Show Graph to render it.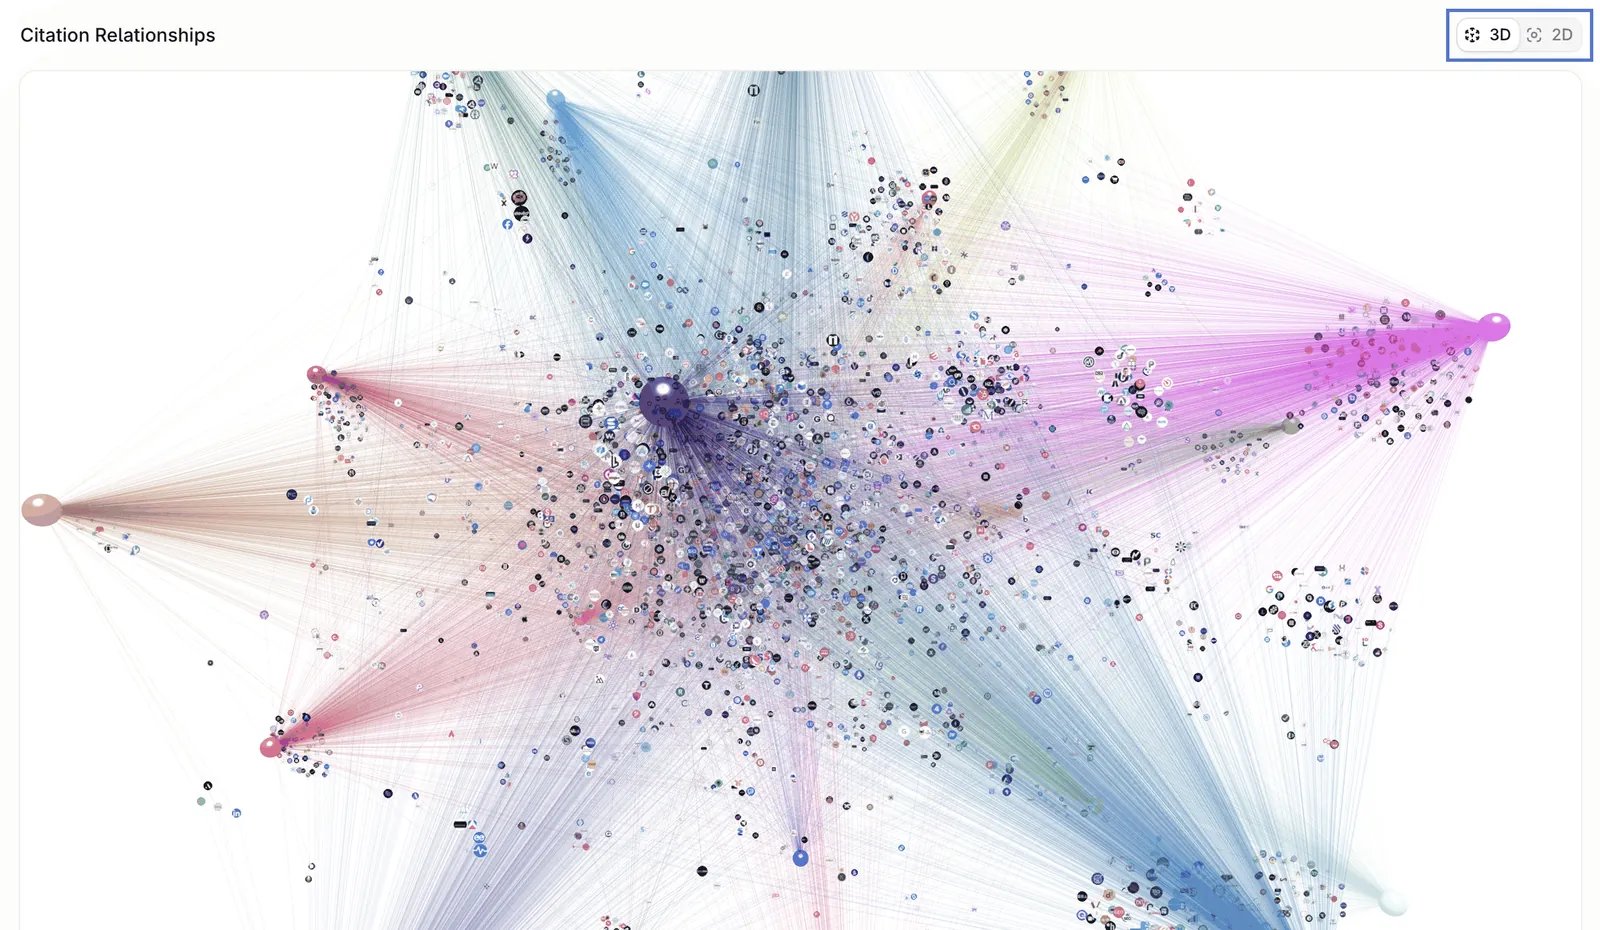
Prompts
The Prompts tab shows performance for every prompt you track, and the queries answer engines generate from them.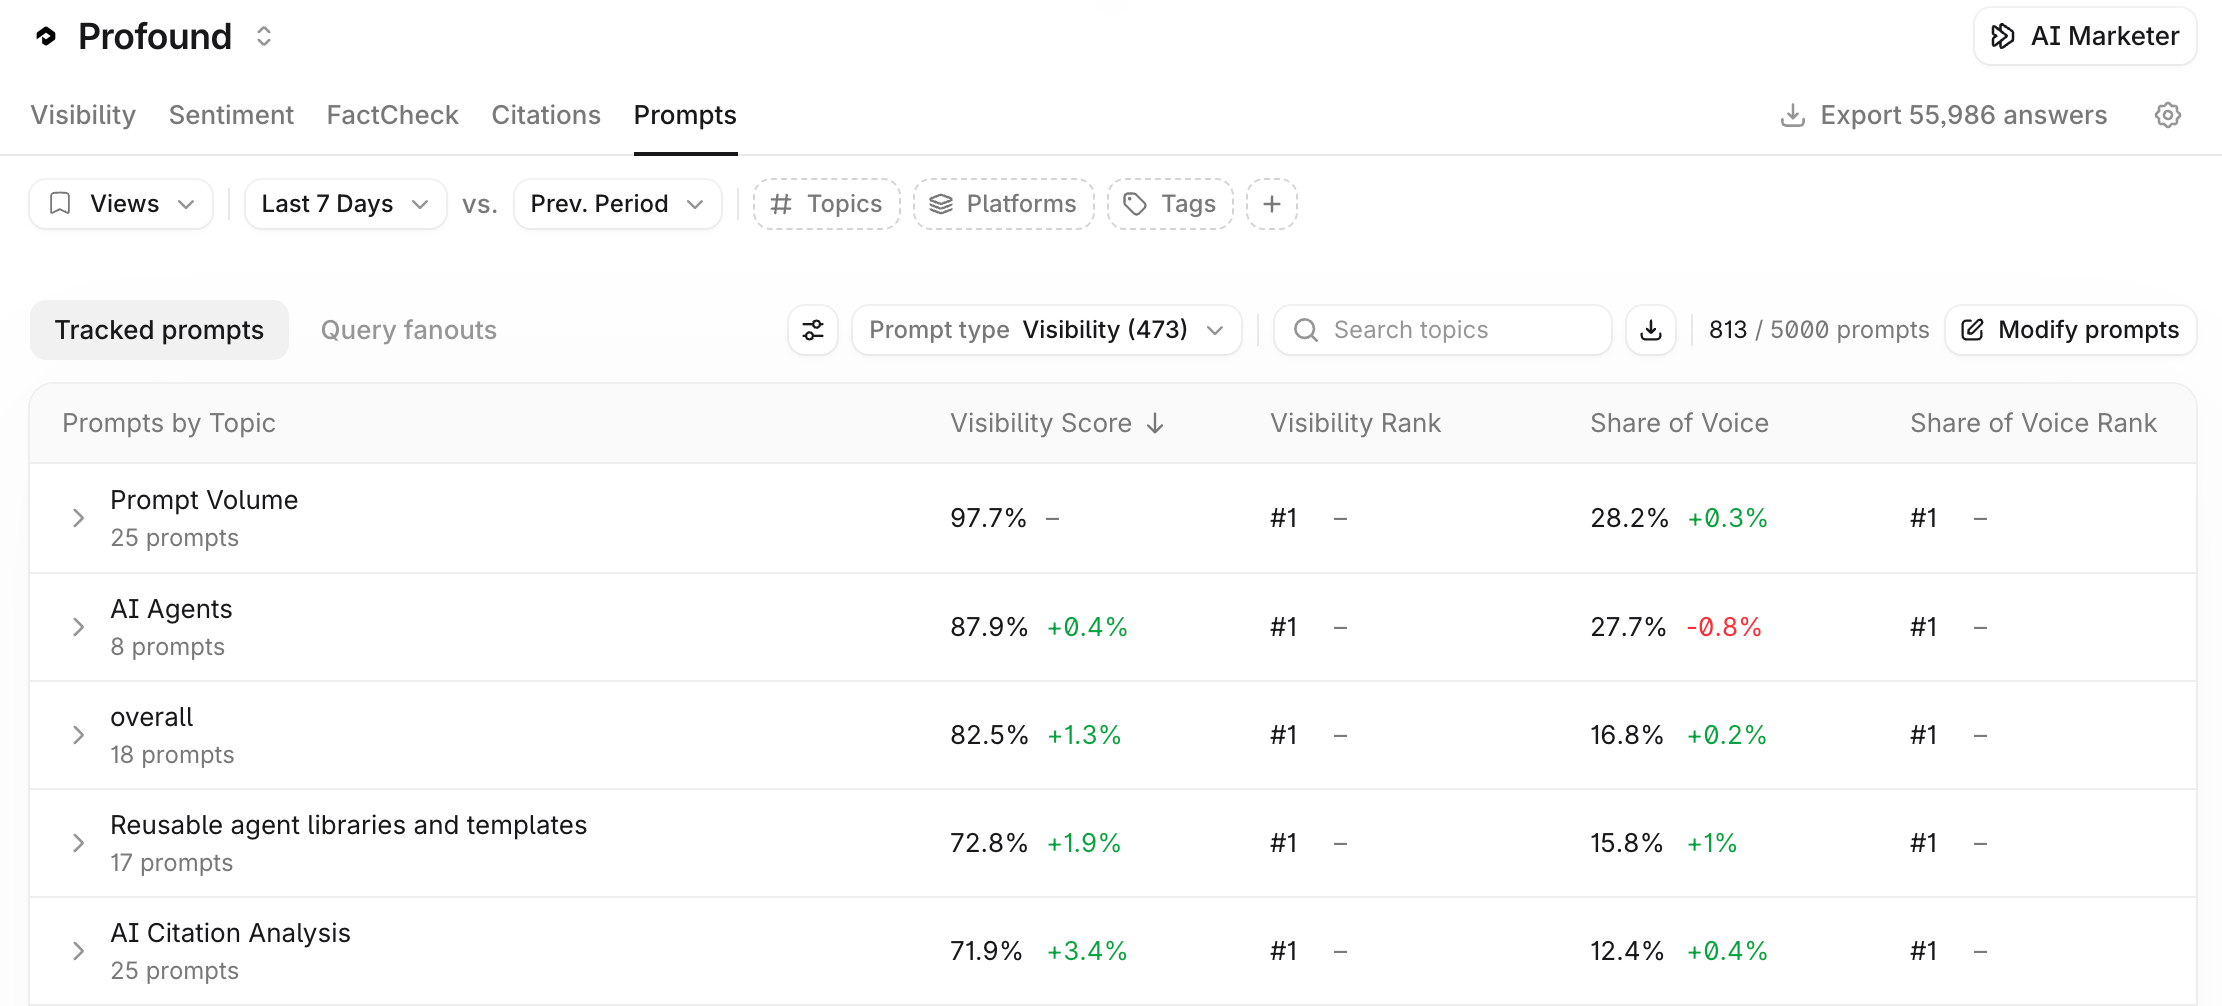
Tracked prompts
The Tracked prompts table groups prompts by topic. Expand a topic to see the prompts within it. Each row shows Visibility Score, Visibility Rank, Share of Voice, Share of Voice Rank, Average Position, Citation Share, Citation Rank, Executions, and Prompt Volume, each with its change versus the comparison period. Sort the table by a metric’s current value or by its change versus the comparison period. Controls above the table:- Prompt type: filter to prompts with a given analysis type, such as Visibility, Sentiment, or FactCheck.
- Search topics: find a topic or prompt by name.
- Download icon: export the table.
- Modify prompts: open the Prompt Designer to add, edit, or tag prompts.
- Settings icon: change Group by (for example, topic) and Customize columns.
Query fanouts
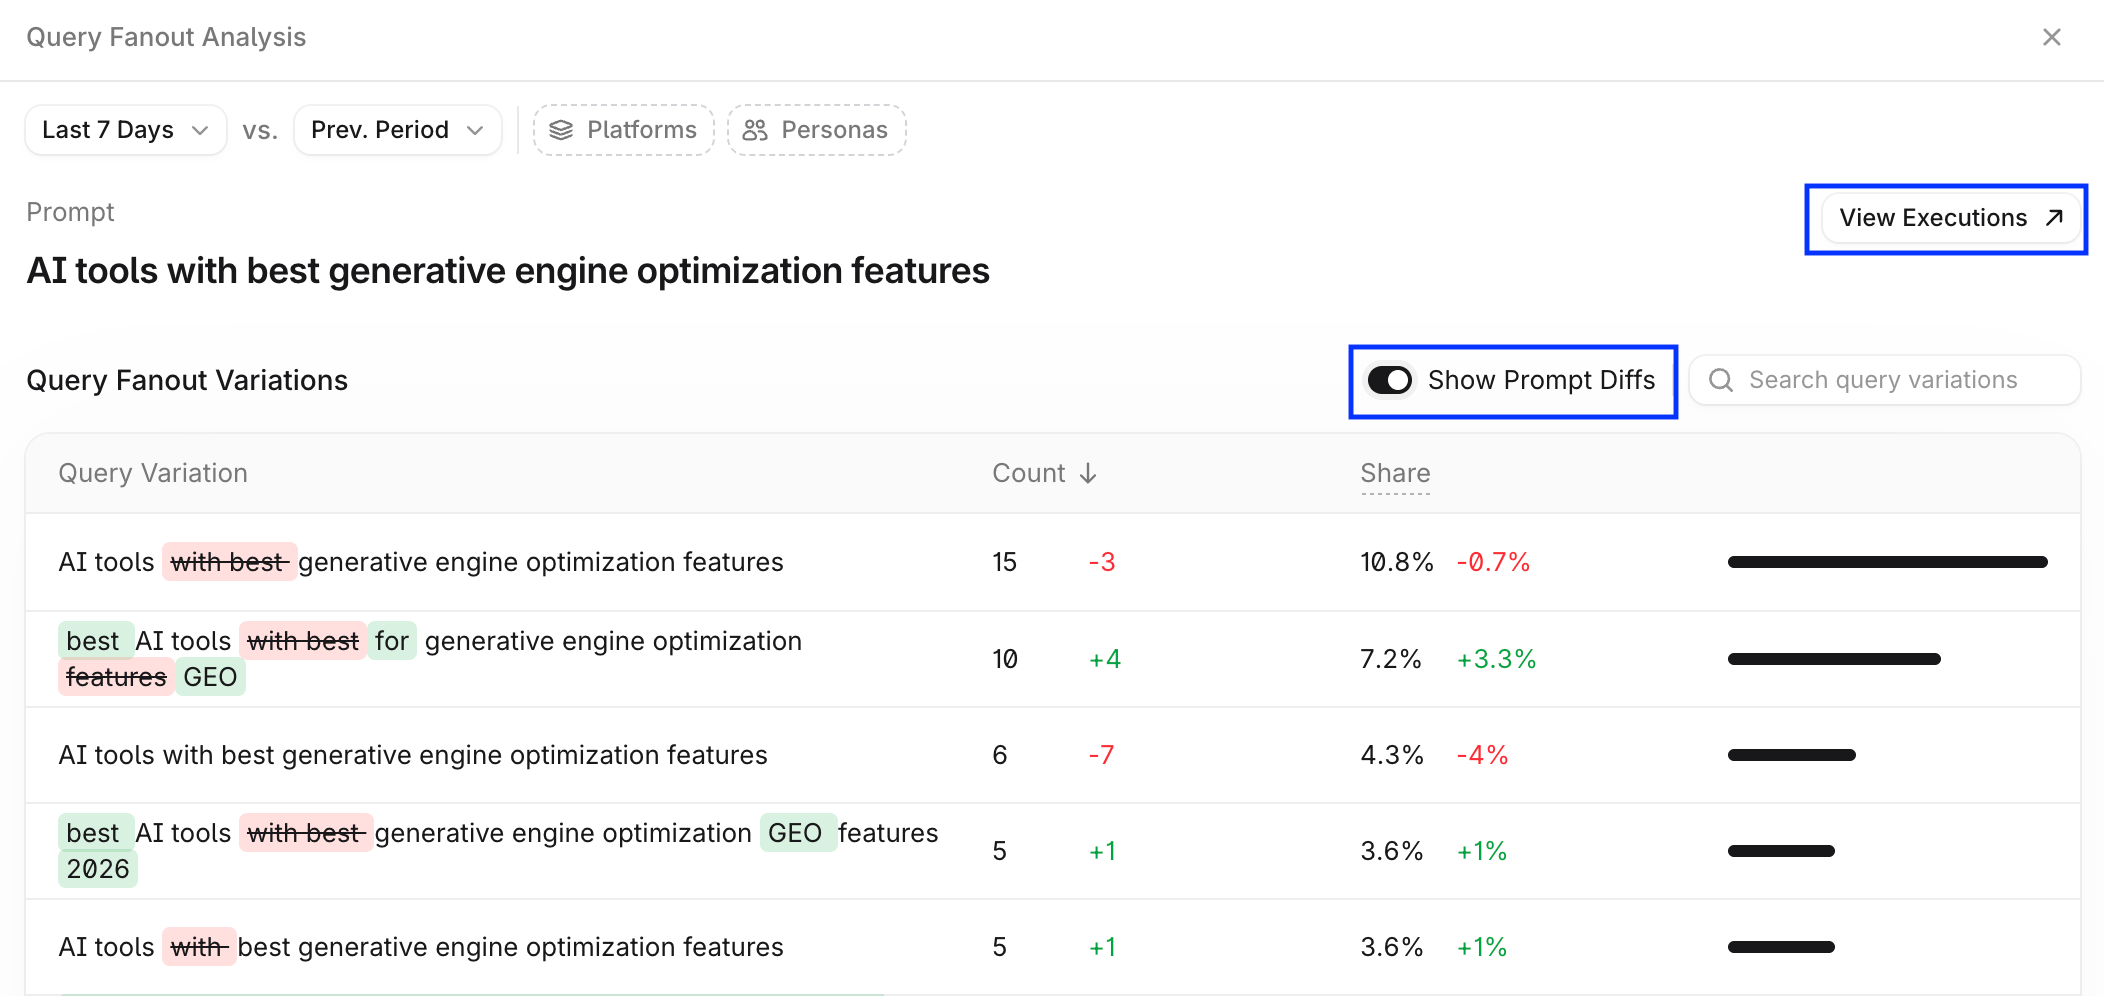
Answer engines often turn a single prompt into several search queries before they answer. The Query fanouts view shows those queries for each prompt you track. Each row is a prompt, with its Query Count (the number of distinct queries generated in the period) and Average Queries Per Execution. Expand a prompt to see the individual queries. Select View all to view all queries for a prompt.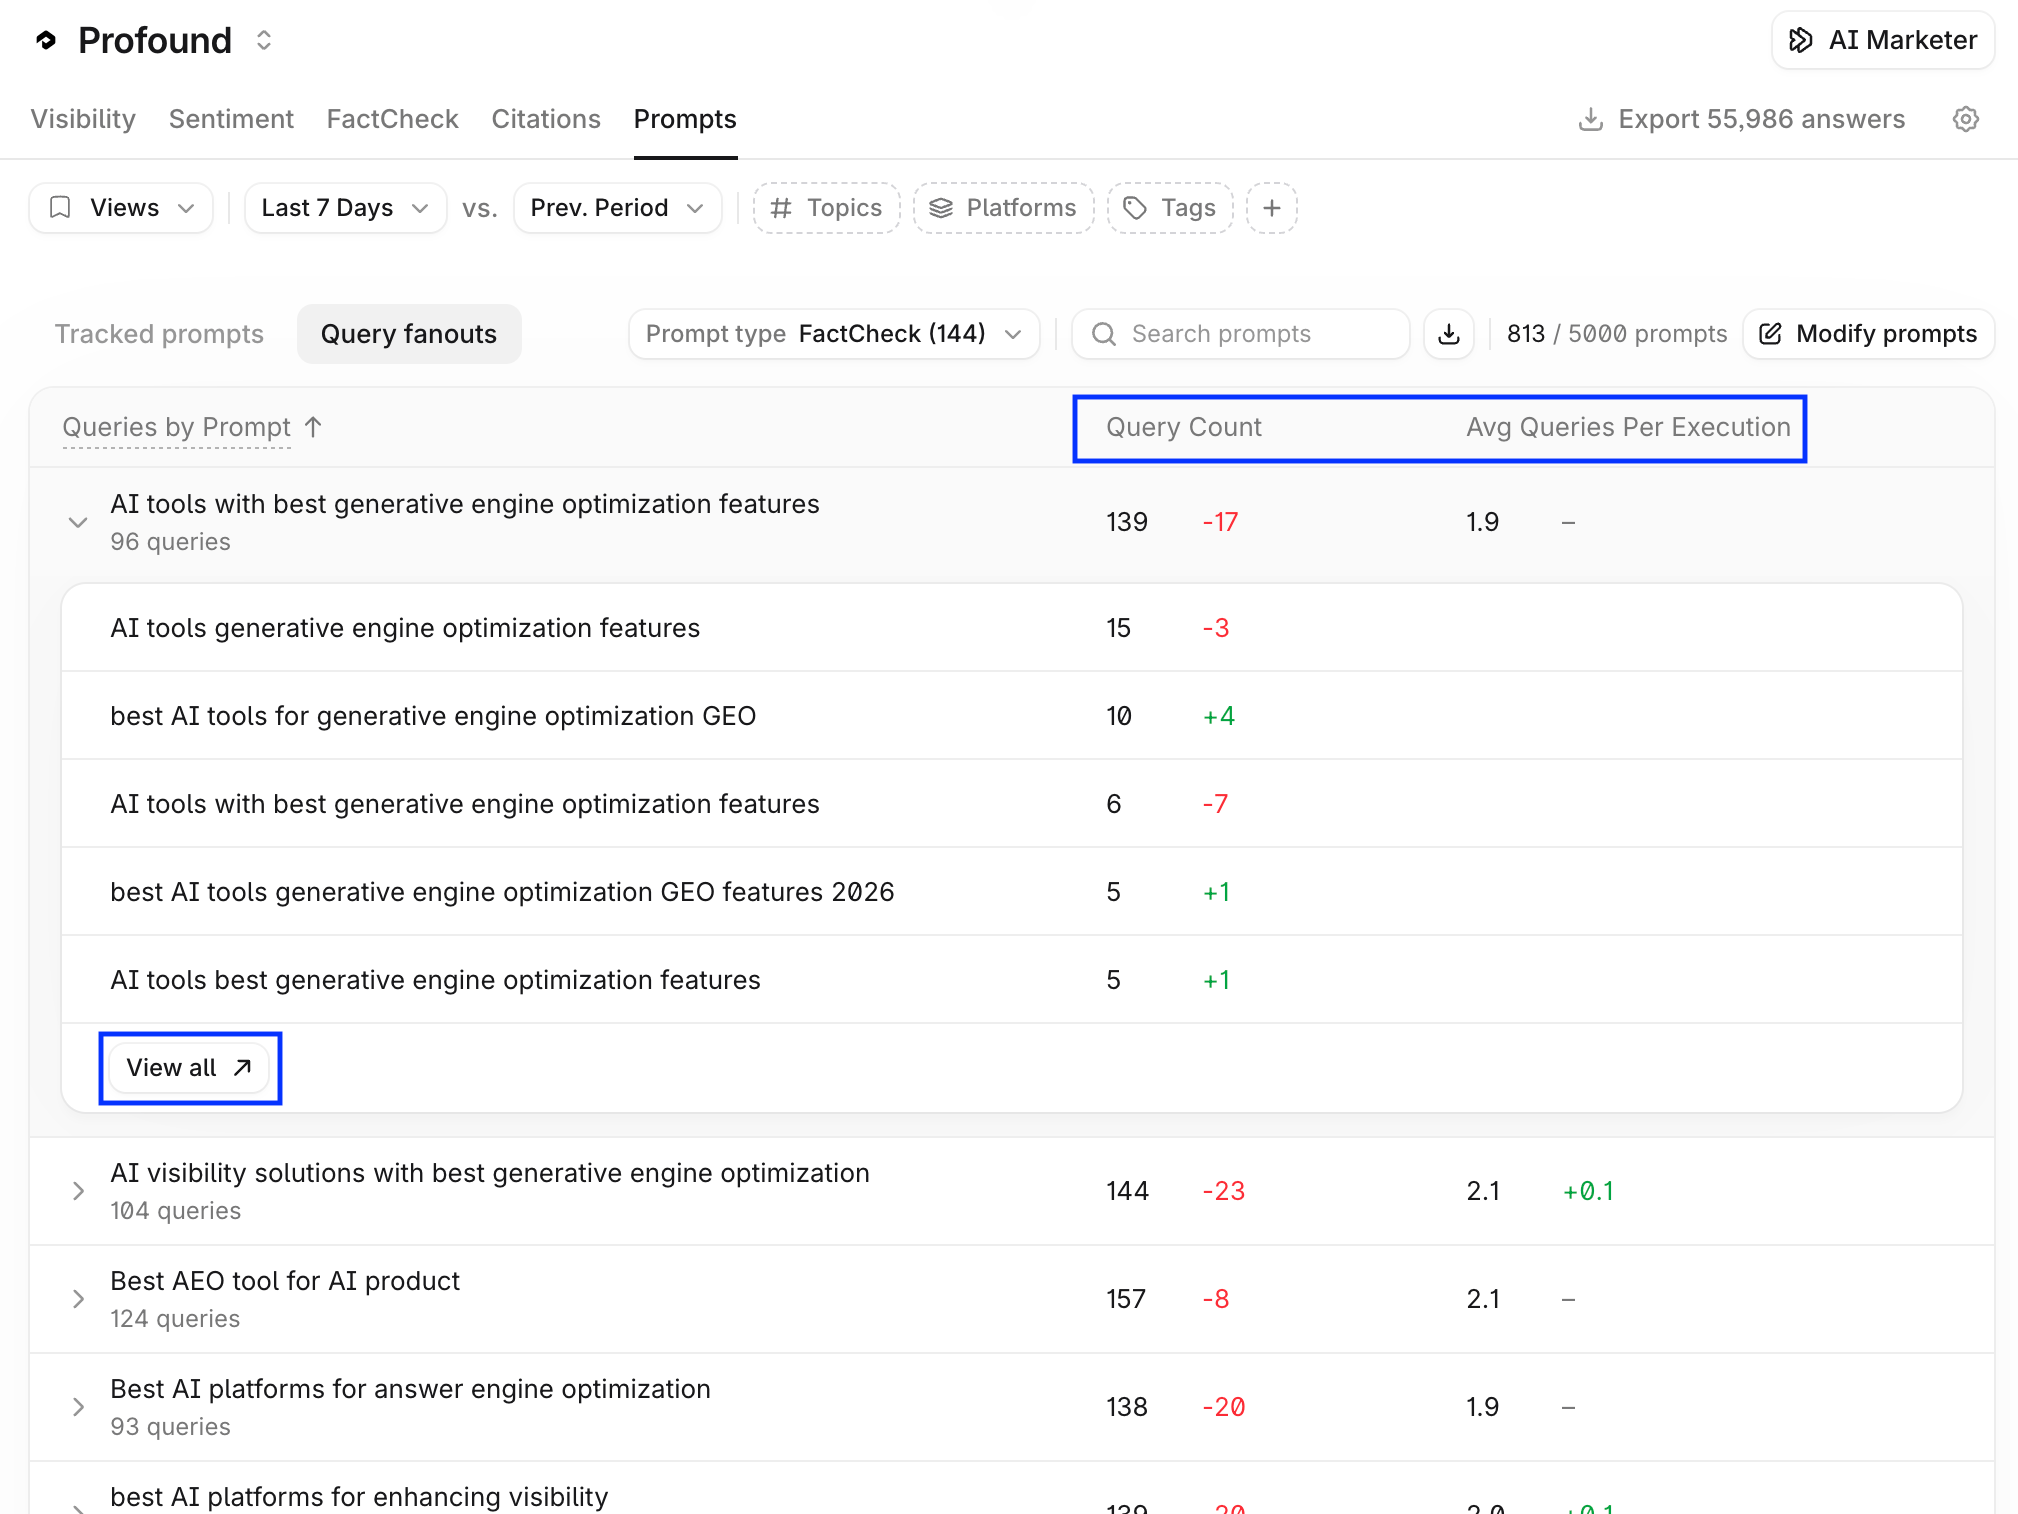

Sentiment
The Sentiment tab tracks how answer engines describe your brand. Learn more in About Sentiment and the Getting started with Sentiment guide.FactCheck
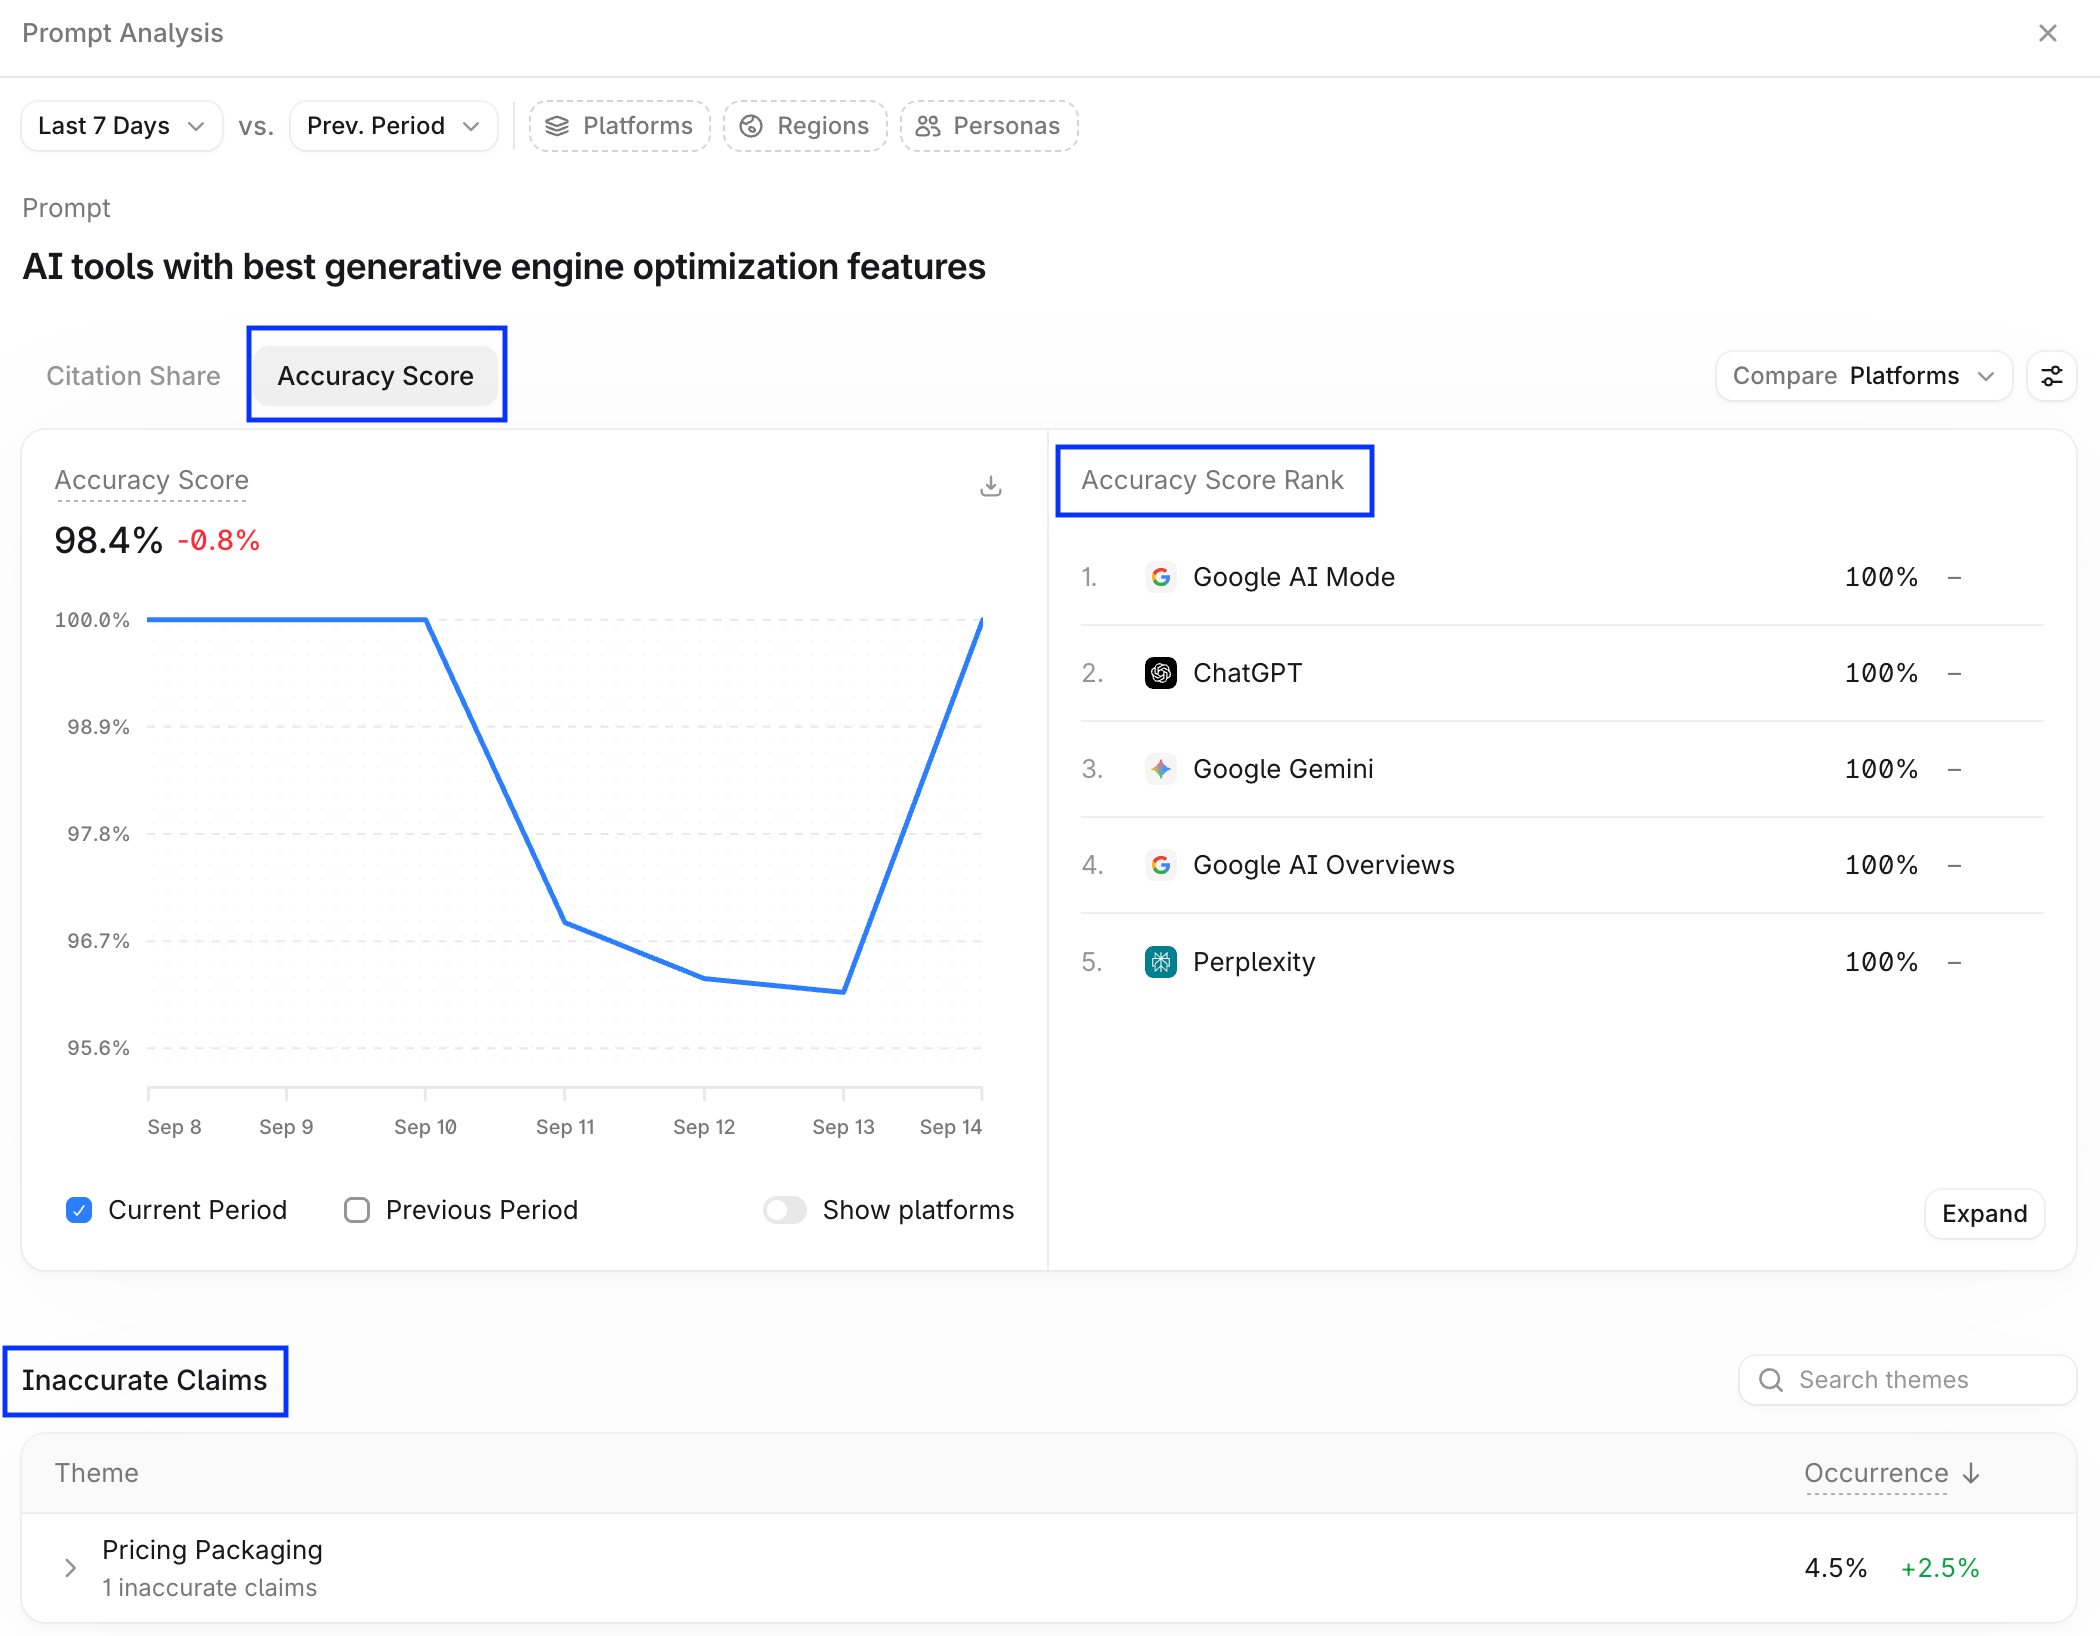
The FactCheck tab tracks the accuracy of what answer engines say about your brand. Learn more in About FactCheck and the Getting started with FactCheck guide.Investigate charts with AI Marketer
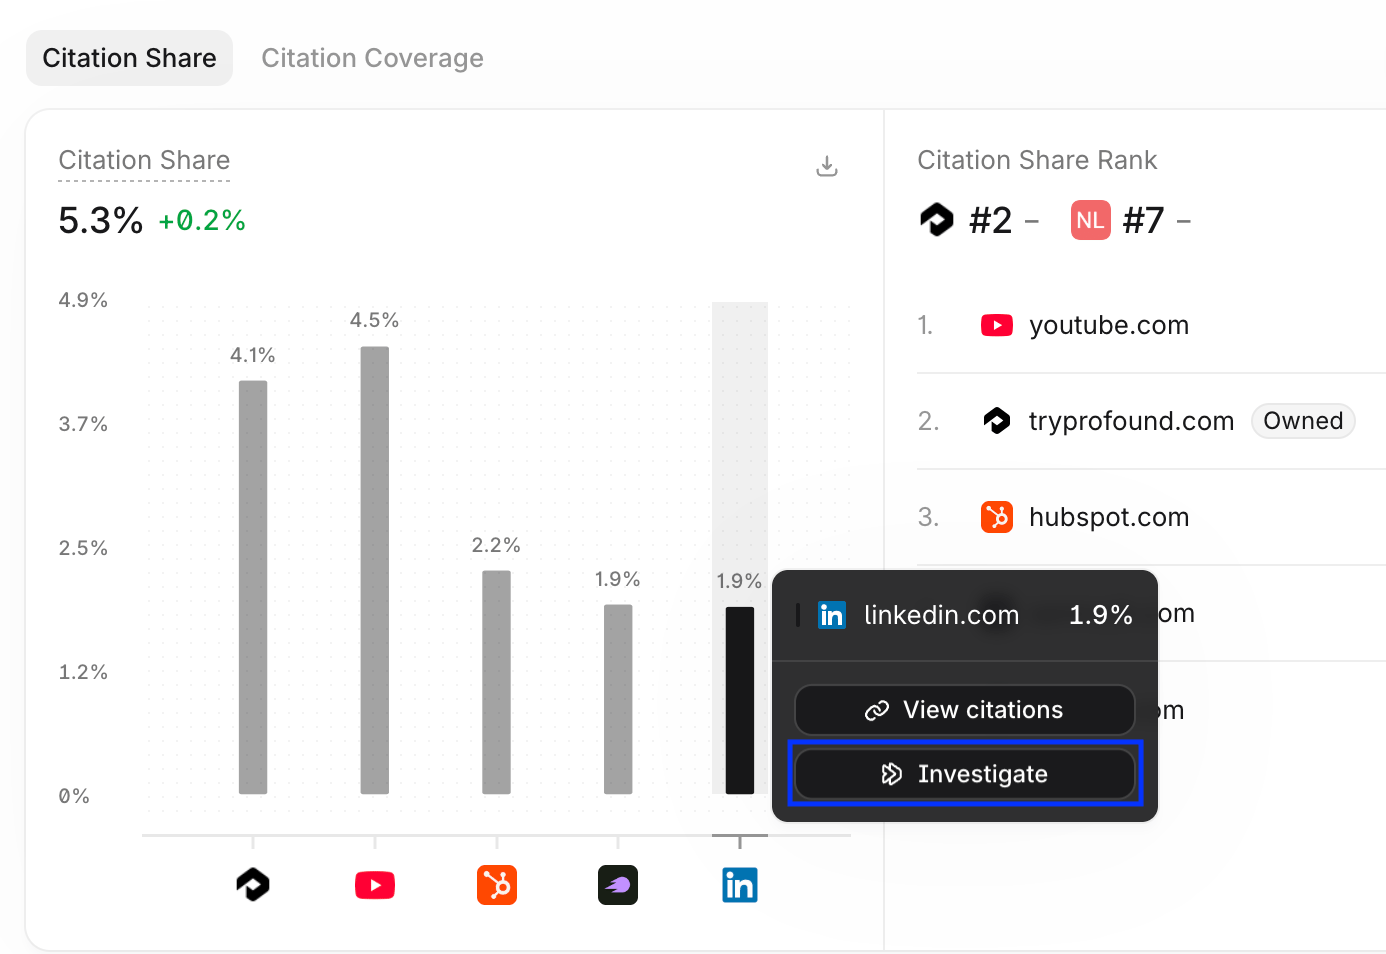
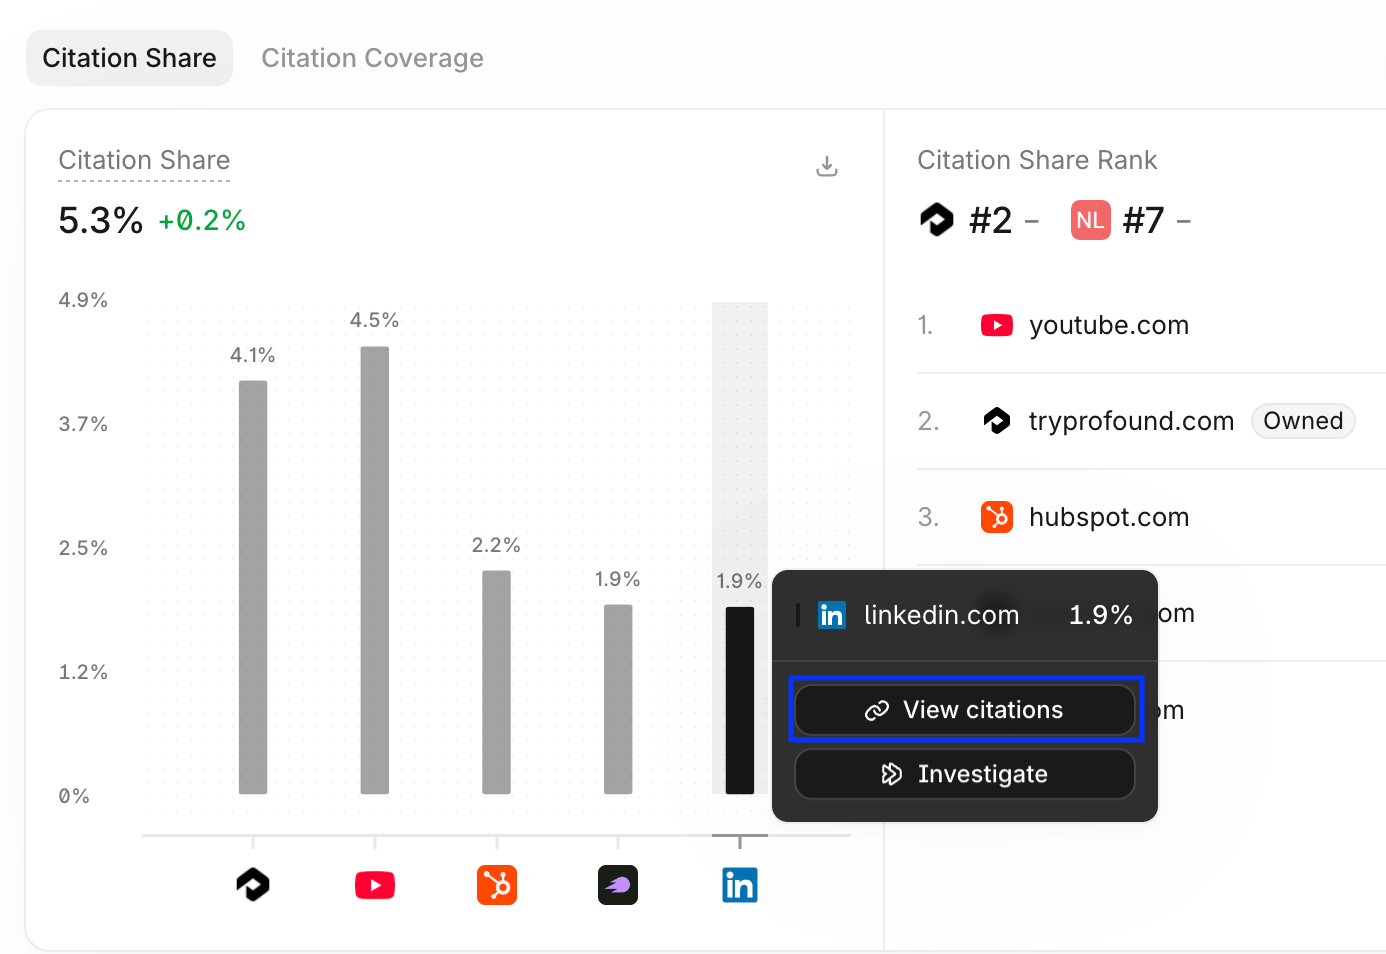
To ask AI Marketer to interpret a chart, select a point or a date range on it, then select Investigate:- To investigate a single date, click a point on a line chart to pin that date.
- To investigate a period, click and drag across points on a line chart to select a date range.